Thursday, February 21, 2013

Attack, Defend and the Dark Arts

First of all, clear your mind of the notion of there is any such thing as the “one strategy”. Instead a strategy consists of multiple parts in a game of chess between companies. You manipulate the entire map to create an advantage and you may act in entirely opposite ways on different parts of the map e.g. you may use an open technology approach on one part of the map whilst simultaneously using a closed approach on another.

Many of the techniques we’ve already covered in this series, for example: -

Shared components
The exercise of mapping should provide you with a list of shared components. These should be treated as such. Obviously you need to consider single points of weakness and systemic failure along with whether you can buy in external services but equally you can look at providing these common components as services yourself (an opportunity). What you want to avoid is duplication of effort and waste.

Efficiency reforms & rationalization
The exercise of mapping should hopefully have highlighted some deltas in how groups treat activities. These are opportunities for efficiency gains i.e. questioning why we need to customize oue operating system? Detailed investigation may also provide areas of wasted effort i.e. things which aren’t used. It’s always surprising how much of the legacy estate does nothing but continues to be maintained. Lastly once you have maps you should be seriously asking why any late product stage or commodity components aren’t provided either through open source or utility provision.

Driving a system to a more evolved state though an open approach
There are numerous reasons for using an open technology approach but the basic principle of driving an activity to a more evolved state, enabling greater efficiency and feature completeness should always be considered.

“Platforms for Innovation” and exploiting ecosystems through ILC
Any activity or data you consume or generate (whether currently considered core or not) has the potential to become a platform for innovation and an ecosystem grown around it. Building ecosystems around components is a great tool for increasing efficiency, innovation (as in genesis of novel and new) and improving customer focus.

Reducing barriers to entry
Equally open approaches can be used to reduce barriers to entry into opponents’ value chains. When you’re competing with someone, never hesitate to give your opponents an additional headache.

Land Grab
Sometimes you can see an activity is evolving and you haven’t quite worked out how to exploit it yet. Land grabbing the future buys you a lot of time. Take Ubuntu vs RedHat, on the server market that was an uphill struggle but Ubuntu walked in and took over the cloud space with relative ease. Even today, Ubuntu is still the dominant operating system used on Amazon and other equivalent clouds as well as being entrenched in platform projects like CloudFoundry and open source efforts such as OpenStack.

Creating a centre of gravity
Open approaches (whether source or APIs) are excellent means of creating ecosystems through which a centre of gravity around a topic can be built and maintained. If you’re at the heart of this, these are excellent sources of recruitment. As a small London based company, I successfully used the Perl Community to recruit some of the best and brightest. Never miss this opportunity, as talent is rare.

Exploiting constraints
If you’re up against another company, look for constraints e.g. the example of Hardware Vendors vs Amazon. If you can find a constraint then exploit it without mercy, as these are often time-limited opportunities.

Creating constraints
When an opponent doesn’t have a constraint, you can always create one for them by buying up key parts of their value chain (i.e. the suppliers). Fairly risky, capital intensive and obviously suffers from stimulating demand in the component you’ve just attacked (which means new entrants).

Building value not wasting it.
Look at your components and ask can I turn this into value if it isn’t already? A good place to examine is those more commodity components (which can be turned into utility services) or your data assets and in particular if the data is unique (like purchasing behaviours) whether this is true for aggregated data can an open data approach be useful?

Changing the characteristics of a component
A tricky game to play as you’re looking for a way to change the value chain associated with a specific component. This sort of technique can be used against an entrenched large player, you’re aiming to develop in an alternative market, get big before they react and then hopefully move into their market. This game depends upon exploiting your opponent’s inertia to change.

Slowing down evolution
A dark art that involves either the use of intellectual property to prevent competition or lobbying of Governments to create protective barriers for your value chain. 

Misdirection
One of my favourites and one I’ve used a variant successfully in the past. Suppose you’re under attack from a new entrant and are not prepared then you can buy yourself some time by encouraging them to focus on the wrong thing. With start-ups, the best way is to fund them to do something that absorbs engineering talent and is completely useless. They often jump at the chance of a paycheck from a well-known company name and lose sight of the prize.

Hence, if you’re a management product vendor and a start-up builds a utility management service then fund them to build a version that integrates with your product. Even better, if their utility service is planned to be open source, make sure the integration version isn’t. Whilst they are focusing on building the integrated system and sending confusing messages over licensing to the market then use this time to build and then launch your own utility services.

Your actual strategy may include many if not all the techniques described (and this is not an exhaustive list). However, there are some specific techniques I’d like to look at in more detail using a play vs counter format.

Play: Differentiation
A typical play is differentiation; as in create a functional difference between your offering and those of competitors. This is not about being more operationally efficient but provision of something that most of your competitors don’t have. When looking at the top-level components that serve the needs of the consumer, you’re looking for something novel and new which can be bundled into the offering (either tightly or more advantageously loosely coupled). The mapping exercise may have already given you several of these unmet needs. This sort of play depends upon your ability to experiment, to gamble and to guess right. It’s highly risky due to the chaotic nature of the novel and new.

Counter: Ecosystem
A good way to counter a differentiation play is not to face it head on as this pits your company’s ability directly against the competitors. If they’ve got more talented people or they’re just plain luckier than you then it’s a battle you can lose. A better approach is to build an ecosystem of company’s and individuals (an alliance) to compete against the company with sharing and collaboration between them. This necessitates the use of an open technology approach, for example open source or alternatively provision of an API (all APIs being open) for a common component and the use of a model such as ILC.

Counter: Tower and Moat
Rather than attempting to compete directly on differentiation, you can aim to eliminate any value in differentiation. For example let’s imagine you’re the CEO at Salesforce, a company that provides a more commodity form of CRM. When a competitor (in the product space) attempts to differentiate you can simply acquire an equivalent function and provide it freely as part of your core offering. The purpose of this is that you aim to make revenue through your core offering (e.g. CRM) and then eliminate any differential value competitors might gain through additional activities (social CRM, chatter, analytics etc).

The core revenue is your Tower with the void of differential value around it is your Moat. This approach is particularly useful if you occupy the future battleground i.e. you’re the commodity player vs the incumbent product players. By growing your business and eliminating any differential value in the space, when your competitors eventually realize they have to switch it becomes almost impossible for them to compete with you.

Play: Standardize
A typical play is to attempt to standardize an activity around your offering. The principle reasons tend to be that your competitors will incur a cost of transition to the standard and / or you’re aiming to create a competitive market and exploit opportunities such as exchanges, assurance or brokerages. Open technology plays can be a powerful tool in making this happen.

Counter
The route by which you may counter depends upon relative positions of each player, consumer vs supplier power and which ecosystem governs the evolution of this activity. 

For example, if the dominant public defacto plays a standard game then you need to either rapidly adopt it or build a larger alliance against it or attempt to use standard bodies / legislative barriers to prevent it. Equally, if the activity is mainly governed in the Enterprise ecosystem you can look to pushing this towards the more public consumer ecosystem (and exploit consumerization effects).

If the player initiating the path is smaller and less established, you can immediately counter with your own standards effort and directly engage in a battle over standards. This will require overcoming some internal inertia due to past success. If you’re the dominant and have the supplier power then you can often ignore such standard efforts.

Play: Creating a level playing field
Let us suppose your value chain consumes an activity that is provided by a captured market (i.e. it’s is constrained to a few suppliers). You maybe locked-in to a particular approach and wish to disentangle yourself in order to find more efficient ways of consuming the activity particularly if the activity is really a commodity but you’re consuming a high cost product. 

The ability to play this game depends very much on your consumer power in relation to suppliers and normally requires multiple lines of attack. If your consumer power is weak then you’ll need to form alliances.

Let us assume you’re a large consumer with strong power i.e. you’re a Government agency such as the Department of Veteran’s Affairs purchasing electronic healthcare record systems. Your primary goals are to create pressure on the suppliers and open up the market, hence you can: -
  • Change purchasing policies. When renewing, a cost of exit is calculated and added to the system being offered. Hence if you have some form of proprietary database and the renewal is $100M and the cost of transition to another systems is $150M, the then the renewal quote is considered as $250M. If an alternative more open system would cost $120M but the cost of exit from it (due to use of open standards) is $40M then its quote is considered as $160M. The purpose of this approach is to drive pressure onto the suppliers to enable switching. This is counter to the normal way of operating when the cost of exiting a system is added to the system that you’re moving to and hence encourages incumbents to increasingly raise exit costs.
  • Adopt open standards. Making a clear preferential for more open standards (i.e. Royalty Free) is a blunt tool but especially effective when combined with changing purchasing policies.
  • Make the system open source. This can have two roles, one in part as leverage against the suppliers, the second is to encourage new entrants into the market especially future providers of utility services that are unlikely to come from incumbent providers due to inertia they suffer.
  • Componentization and strong coupling. Often elements of a system will be commodity whilst some activities are genuine differentials e.g. even Electronic Health Care record systems will contain novel components. You should aim to break the system into components with defined interfaces being careful to avoid strong coupling. Example of strong coupling can be found in most desktop rollouts where components such as the device to operating system are all commodity but a line of business application has strong links to a specific operating system forcing you to treat it as a product. You should aim to break these links i.e. applications are delivered through neutral browser interfaces where possible.
Counter: Creating a level playing field
The best long-term approach is to adapt to the environment and look towards operationally efficient provision of more open systems. In particular, by adopting this model you can aggressively look to provide utility services (where applicable) and re-use these for other markets. However, this does require overcoming significant internal inertia which will often been couched in terms such as “cannibalization of existing business”

If you decide not to adapt then against a determined opponent this is difficult to counter because you’re trying to persuade them that living in a gilded cage is better than no cage. Much of this has to be achieved through lobbying and weakening the effort through fear, uncertainty and doubt. Again a multiple line attack is required :-
  • Attack the purchasing policy changes. It’s critical to emphasize that change in policy will incur additional cost as decisions to move towards more open and interoperable environments will incur the cost of exit.
  • Reduce pricing. Often allies can be found within the company that is executing this play particularly those people who benefit from having an association with your company. Provide them the means to counter the effort by reducing pricing and showing more efficient provision.
  • Bundling. The breaking of a system into components is particularly dangerous as it allows new entrants that may erode your market. Provide favourable terms for bundling.
  • Confusion. One of my favourite dark arts is to exploit the confusion of choice. In this case, you would emphasize the management overhead of dealing with different components and suppliers, ask who would test the components, offer your own system interfaces as being the “open standards” and play on the company’s own inertia (concerns over skill set changes, disruption of existing practices etc).
The overall goal is to create enough uncertainty and doubt that a gilded cage looks like the better option especially when combined with price reductions.

Play: Sweat and Dump
This play is used when you have something of value that you know will diminish and hence need to get rid of the costs associated with it.  

For example, lets suppose you’re the CEO of EMC and you’ve seen how VMware (a subsidiary) has grown however you suspect that as infrastructure gets commoditized further towards utility services then proprietary software plays are going to have a tough time. You can’t open source the technology because of the write offs involved. One way to play the game is to continue with it as is, milk it as much as possible whilst building a new line of business further up the value chain (e.g. platform, management line). 

If you can exploit the market (e.g. the current enterprise demands for private clouds) then you can spin out the future business (e.g. Pivotal initiative) with a view of getting the past existing business (hypervisor) either acquired by another or floated on the market. Such a move is always tricky because timing and messaging needs to be perfect as you have to convince the market that you’re letting go of the business because of some conflict or other reason and not because you think it’s a future dead duck. Leo Apotheker had a good strategy for HP but the messaging was awful.

The icing on the cake, is when you can re-invest the capital into what was disrupting you in the first place e.g. EMC making a huge utility computing play.

Sweat and dump is also a way of dealing with legacy estates. If you suspect that financial ERP will become a utility (many large companies are looking to provide such services) then what do you do with your legacy? Well, first keep investment minimal and look to minimize future commitments whilst you plan to move. Enterprise clouds for example provide a way of doing this. Rather than re-architect for utility services based upon commodity components, find someone willing to provide you with utility services for non-commodity, high-end server infrastructure. Get someone else to load up the capital-intensive infrastructure costs (and ideally utility based application licensing) whilst you plot your move to a modern SaaS environment. 

Counter
Don't get caught out by it.

Your Strategy
Once you’ve looked at the opportunities, the “where” to attacks, you can then start making trade-offs and choices. Your strategy is the result of this. 

You might decide to drive some components of the map to a more evolved state in order to increase efficiency whilst using an open approach to undermine a competitor’s barrier to entry and simultaneously building an ecosystem around a new utility service from a commodity component in order to generate future revenue streams whilst misdirecting a start-up. You might combine this with sweating and dumping a legacy estate through an enterprise cloud and creating a level playing field around another. The point is your strategy will have many different parts but each part you should be able to articulate precisely why you’re doing it.

After this it’s all how (open source XYZ, use marketing to help establish a community), what (hire a team of software engineers, hire a community manager, launch a community event, create a public repository) and when.

Oh, and if you're assuming that no-one thinks like this, well, I’m afraid they do. This is what strategy is all about. It’s not about bland statements of becoming more innovative or more efficient or being nimble (thank you Dilbert). It’s about playing the game.

---

Post 23 on the Management and Strategy series.

Next post in series ... On Structure

Previous post in series ... The Strategy Game

Beginning of the Management and Strategy series ... There must be some way out of here


What things mean ...

Being a little bit jaded this morning, hearing people describe things that are commonplace as a source of competitive advantage (e.g. social media) and reading through a work which can be described as nothing but backwards causation (e.g. Company X did Y therefore Y must be right).

So, I bring you ... what things mean

We're being hit by disruptive innovation
Likelihood of being heard : 80% or higher.
Translation : the executives are currently being schooled.
Accuracy of translation : 90% or higher.
Most disruption occurs not through unpredictable market changes caused by innovation (being novel, new and uncertain) but instead the disruption is an entirely predictable market change which the company failed to plan for (e.g. cloud computing). The citing of disruptive innovation is often an exercise in covering corporate failure.

We're going to innovate!
Likelihood of being heard : 90% or higher.
Translation : the executives have recently been schooled and are getting desperate
Accuracy of translation : 95% or higher.
Innovation is both high risk and highly uncertain. This of course assumes we're talking about innovation, a novel and new act, and not the numerous sorts of things (a feature improvement, opening a new market, shifting a pre-existing product model to one of utility services) which are window dressed as innovation. When a company announces it's going to innovate its way out of trouble, the one thing you know is they've been completely played out of the market and are in real trouble. It's almost never pretty, this is last sip in the last chance saloon time.

Our culture let us down
Likelihood of being heard : 100% or higher (I can't resist)
Translation : the executives were schooled and are looking for someone else to blame
Accuracy of translation : 100% or higher (just for those people who like to use the term infinite inappropriately)
Culture isn't fixed but can be gamed and altered, in the same manner that inertia to change can be overcome. Culture is often used as a rearguard action to cover complete executive failure of strategy.

Our executive strategy failed.
Likelihood of being heard : 0% or less (actually, some are pretty honest about this in private though denial is also common).
Translation : we failed.
Accuracy of translation : Infinite % (see ... I can't resist the jibe)

Tuesday, February 19, 2013

The Strategy Game

Now you have a map, you can start to look at how to manipulate the environment to your advantage. This is the essence of what strategy should be about.

To start with, I’ll use an example - the Fotango Map (Figure 53) – and explain why we took the actions we did, then we will look at the subject more broadly. I'm often asked why do I use that example, well because the company is now dead (killed by the parent rather than through its own failure of strategy) and so it's ok to talk about the games it played. I don't generally talk about active companies.

Figure 53 – Fotango Map


The company’s service (online photo storage) was shifting to relative competition with players becoming established. We were losing that battle because we had to focus internally on the parent company needs and lacked the investment. Alternative services such as Flickr were rapidly dominating the space.

Our differential was in image manipulation but being uncertain we had no way of foretelling its future. We certainly were unable to predict the rise of Facebook and Instagram and what would happen, this was 2005. We also knew our existing business of meeting our patent company’s need was to be outsourced.

The platform and infrastructure plays looked the best option due to established markets and inertia that incumbents had, as both were suitable for utility provision. Infrastructure was capital intensive and we could assume that some other new entrant would play the game, so we could build a PaaS and exploit IaaS as it developed. However, it was probable that an IaaS play would develop a strong ecosystem and we would see centralization, hence to strengthen our position we planned to open source all our IaaS technology in 2007 to encourage a competitive market.

The PaaS play also suited us because the skills to build large-scale distributed architectures to support it would be scarce and a barrier to entry. We had that capability. 

By open sourcing the PaaS technology itself we would overcome many of the adoption barriers and rapidly drive towards creating a standard. Our goal was not to be a PaaS provider ultimately but to build the exchange, brokerage and assurance industries on top of this. Our strategy was developed from the above map and our understanding of it. The strategy was all about the why with the how, what and when coming after.

There are multiple ways of using maps to gain an advantage. You can use a map to see how components can be combined to create new activities (i.e. genesis) but I tend to avoid this. Genesis is a high risk and uncertain activity hence it is better to get others to do this for you and to exploit an ecosystem under a model like ILC.

You can also look at links within the value chain. For example take something as trivial as a desktop role out. You might find that you’re forced to treat the operating system as more of a product than a commodity because of some link to another component (such as a line of business app). By forcing the app into a browser you can often treat wide numbers of components as a commodity.

My preferred technique though, is to take advantage of competition driving any component to a more evolved state (i.e. more of a commodity or a utility).  Hence I tend to look at those components that are put down as being in the product stage especially those that are put close to being a commodity and ask the question “Is this suitable for commodity provision?”

You can check by looking at the market for weak signals such as consumers questioning why this thing costs so much. Take financial ERP, the constant business grumble combined with its ubiquity tells you one thing - it's ready for the game. Components that are consumed as products and which are suitable for provision as a commodity specifically via utility services are a gold mine.

One of my favourite ways of double checking this is when we identify such an opportunity then to ask a group of people familiar with the subject to pretend we have built such a service and what we need them to do is to write the press release. If they can do this well - clearly and precisely – and without recourse to heavy investigation of the opportunity, we can be pretty sure we’ve got something widespread and ubiquitous enough to be suitable.

You should then aim to create new services with ecosystems around them. You can be fairly confident that existing players will have inertia and won’t see the expected change coming (the shift from peace to war) and if your service can become a component of higher order systems then you can benefit from volume effects.  These are huge opportunities which if you’ve been consuming the product you’ve probably built some of the necessary skills to make happen – as was the case with Fotango and platforms.

Obviously at this time people can raise the notion of focusing on core (as happened with Fotango's parent). Unfortunately maps don’t solve internal politics but generally these days I point to Amazon and say, go explain to them that they should have stuck to selling books online.  Amazon is without doubt my favourite example of a company that commoditizes existing industries through building ecosystems and utility based platforms. They’ve repeated this model successfully in industry after industry.

The process of building maps should provide you with a fairly hefty list of target opportunities, areas of efficiency and shared components. Once you’ve added the details (differentials, forces and barriers to entry) you can then start to look at manipulating the environment and creating new advantages.

From this you can decide where you’re going to attack and where you’re going to try and protect. You can now start applying tools to help make this happen e.g. use of open technologies to drive something to a more evolved state or any of the dark protective arts such as branding, IP or legislation to protect a barrier to entry or to slow a change.

For example, if I want to drive a component to more of a commodity but I don’t want to build my own service in that space, I might simply use open source to do this. 

Or instead, if I have data on travel habits but want to create an ecosystem (so other companies can innovate for me) or to undermine some competitor business by destroying an area of value, I might create an open data service for aggregated market data (i.e. how many times do people travel from one destination to another).

There is a long list of techniques here and I’ll cover some defensive and attacking strategies in the next section but the point is once you have the maps, it becomes a lot easier to see the potential games and to explain why you’re going to do something.

Once you start getting competent at doing this, you can also start to turn your attention to competitors. Even if they don’t have maps, there is nothing preventing you from creating them. Examining their value chains can often highlight potential points of weakness.

For example, any half decent strategist with a map would have seen the shift of computing infrastructure from product to utility services almost a decade ago. If you were a hardware provider of computing products (e.g. servers) you would have known it was coming along with the inertia you would have to the change. You could have prepared for this well in advance.

When the market signals were shouting for the change, you should have been on watch, building highly efficient and commoditized data centres but selling them as high cost rental services along with your products (thereby extracting maximum value in the peace phase of competition).

When the new entrant appeared i.e. Amazon launched EC2, you would be prepared to hit the market fast. Within a year of launch, once it was clear that the change was growing you could have announced a massive utility investment and reveal your new services (i.e. selling those highly efficient but high cost rental services as utility services). 

Your goal would have been simple, flood the market with volume at low cost and stimulate demand. The reason for this is that you would know, if you had a map, that your competitor would have to build data centres to meet the demand and this is both capital expensive and time consuming (a bottleneck). 

Since computing resources has been elastic for the last forty years, stimulating demand beyond your competitor’s ability to supply is an excellent way of fragmenting a market. You could let them led the way for the first year and then swamp the market. By 2009 this market should have been very different with Amazon being a minority player.

What happened of course was deafening silence, as the competitors were unprepared. Many have huge rental services, excellent skills along with large capital reserves but they failed to react to an expected market change. Certainly they would have inertia to the change that would have become embedded in their culture but this could have been managed. Disruption by expected and predictable market change is unfortunately quite common.

The game of strategy is all about preparation, creating an advantage and situational awareness.  In the next sections I’ll look at common defensive and attacking strategies.

---

Post 22 on the Management and Strategy series.

Next post in series ... Attack, Defend and the Dark Arts

Previous post in series ... Differentials, Barriers and Constraints

Beginning of the Management and Strategy series ... There must be some way out of here


Differentials, Barriers and Constraints

We now need to turn to those maps and identify specific roles and constraints for the various components before we start to attempt manipulate the environment through some form a strategy.

The first role we need to identify are those visible top-level components that act as differentials i.e. they provide to the consumer a qualitative difference between our offerings and most of our competitors. Such components will be in the genesis or custom built stage and in the case of the Fotango service, this was image manipulation.

You also need to identify those components that act as a barrier to entry into your value chain through high levels of capital (either physical, financial, knowledge or social). These tend to be hidden further down the value chain and are mainly invisible to the consumer. In the case of the Fotango service, our engineering skill and knowledge in building large-scale distributed systems capable of coping with millions of registered users was such a barrier.

Finally, you need to identify constraints and in particular the balance of power between consumers and suppliers. I tend to use Porter’s five forces here. For those unfamiliar with five forces, these are:-

Rivalry within industry: this can be assumed to be a given though the type of competition changes e.g. from relative competition in the peace phase to a fight for survival during the war phase.

Threat of New Entrants: increases as an activity evolves from the peace stage of competition to the war stage.

Threat of Substitution: often the most difficult to spot and manage, tends to occur in the peace phase of competition e.g. replacement of cable excavators with hydraulic.

Bargaining Power of Suppliers Vs Consumers: the balance of power between the groups affects a range of areas from pricing to dependency to strategic control. For example, in a value chain if one supplier provides one component, then that supplier can exert considerable pricing pressures on your entire value chain.

The balance between these forces tends to change as anything evolves. It also isn’t static within a stage of evolution. For example, when an activity becomes more of a commodity or provided as a utility we will often experience a yo-yo between centralization and decentralization (with a corresponding yo-yo between Supplier and Consumer bargaining power).

With commoditization (i.e. evolution for activities), it is often assumed that the shift towards utility provision means centralization but this is not the case. Whilst the interaction of ALL consumers (demand competition) and ALL suppliers (supply competition) drives the process of evolution, the question of whether a specific activity or data set centralizes or decentralizes depends upon the actions of individual actors (suppliers and consumers) in this market. 

Hence for example, with Cloud Computing and specifically Infrastructure as a Service (IaaS), the shift from product to utility is simply a process of evolution driven by market competition (ALL Supplier and ALL Consumers). 

On the question of centralization, it would have been relatively trivial for the hardware manufacturers to create a price war in the IaaS space around 2008-2010 in order to fragment the market by increasing demand beyond the capability of one vendor to supply.  The fact they didn't is their own fault and also one of the major factors why we might see centralization in the IaaS space. Hence centralization depends upon the actions of specific actors (in this case the inaction of hardware suppliers and hosting companies).

In the future, this may in fact yo-yo from centralized to decentralized or find a balance between the two (as with electricity provision and self generation). Of course this is a change in the means of production and the interfaces themselves are unlikely to change i.e. a shift from central to self-generation does not mean a change in voltage / frequency for domestic power provision.

The interface can often hide a complex market. For the average home consumer of electricity you have sockets and a power supplier. You could be forgiven for thinking your home electricity supplier actually generates the power. However their value chain includes components such as the National Grid where they consume and purchase power from multiple power generators (their suppliers) through a complex market including spot and derivatives. There is no reason your actual home electricity supplier has to own any actual power generation capabilities themselves and they can instead act more like a broker. In the UK, such distinctions are licensed through OfGem with suppliers, generators and non physical traders.

Hence, you should always be careful about assuming that as an activity evolves to more of a utility it will centralize into the hands of a few suppliers. There is a danger that this will happen but it all depends upon the individual actions of specific players in the market. In figure 50, I provided an example of some general changes in the five forces.

Figure 50 – General changes in the five forces


During the Peace phase of competition then substitution tends to be something to watch for but new entrants are relatively rare, competition is often relative between big suppliers and a yo-yo between supplier vs consumer bargaining power can exist but is often relatively minor.

As the activity evolves to more of a utility, hence the shift from peace to war, then competition becomes more of a fight for survival as new entrants appear. The balance of power can shift towards suppliers (centralization) if other potential suppliers such as past product vendors fail to act appropriately. Beyond peace and war, the state of wonder also tends to be an aggressive fight for those new activities but in this case it is more a case of a fight to become established, to prevail over other equivalent attempts to provide the new activity by many new entrants. 

All competition is a fight but it’s worth emphasising (and repeating) the different economic states for any component.

Wonder: New activities appear and a fight to become established occurs in an uncertain and un-established market. Consumers hold the balance of power and you’re competing against other entrants with no idea of whether any will be successful. Everything is a gamble and a huge risk with rapid change.

Peace: Activities are provided in a relatively well-defined, widespread and established market. Large competitors jostle for relative positions and to maintain profitability. Inertia to change builds due to pass success. There is often a balance between consumer and supplier bargaining power. New entrants see an almost impossible mountain to climb and must look to substitute and disrupt existing suppliers often by changing the value chain. Whilst difficult, this can be achieved by adding to or altering the visible components associated with a product (e.g. smaller hard drives, more energy efficient) and then establishing these components in an alternative market. The occasions were the giants are disrupted are relatively few as sustaining change tends to exceed disruptive, however disruption can occur due to changes in the value chain. This is hard to predict and hence defend against and is compounded by inertia.

War: Activities evolve to more of a commodity (or utility), new entrants take up the charge into the space with past giants having inertia to the change. For these giants a fight for survival for their massive established business occurs, many will be disrupted by what is entirely predictable and could be defended against. Due to the speed of change and depending upon how well the game is played, the balance of power can shift to large centralized suppliers. 

At this point, I tend to mark up the map with the following legend (see figure 51) covering differentiators, barriers to entry and five forces. I also include future changes i.e. what happens as activities (or data or practices) evolve and add inertia barriers to change (i.e. caused by past success).

Figure 51 – Legend


Using the above legend, I’ve updated the Fotango Map (see figure 52). From the map, the reader should by now be able to read that Fotango had a value chain of many components at different stages of evolution. The Fotango service itself was building an ecosystem of end users and was in a maturing field that was moving from a fight to become established towards more relative competition. Consumers currently held the power and substitution was a threat.

The provision of image manipulation was a differentiator though we had no idea whether it would be successful. Consumers again held the bargaining power and new entrants providing image manipulation services were common.

Figure 52 – Map of Fotango, 2005


Platforms, which were used to build the Fotango site, were in a relatively peaceful state of competition with well-established platform players and the only main threats being substitution. This activity (like all) was evolving and becoming suitable for utility provision (PaaS). New entrants were likely to take up the charge and establish broad ecosystems that also led to a danger of centralization. Past players were likely to suffer inertia barriers to the change.

Infrastructure was even more of a commodity and was also suitable for provision as a utility (IaaS). It currently existed in a relatively peaceful market of large players with the only main threat being substitution. Those players would have inertia to the change and the new entrants could build broad ecosystems and potentially centralize if the existing giants failed to act.

The future IaaS world could power the PaaS world.

One of the barriers to entry in Fotango’s space was the ability to build large-scale architectures dealing with large volumes of users. This was a highly skilled engineering task and such knowledge could be considered a barrier to entry into the business. 

Writing these maps is a big undertaking. A fully-fledged map for a value chain can take up to two hours of efforts and it's not strictly necessary to go into the detail of mapping out forces, value can be gained just by doing a simple map of value chain vs evolution and just thinking about the above when reading the map is enough. However, I thought I'd at least show you this for completeness sake.

Given 40 or so value chains in an organization, you could be looking at two weeks effort to get a really clear understanding of the environment. But it’s worth it because now that we can write and read maps then we’re finally getting ready to start playing the strategy game.

---

Post 21 on the Management and Strategy series.

Next post in series ... The Strategy Game

Previous post in series ... Mapping a Company

Beginning of the Management and Strategy series ... There must be some way out of here

Monday, February 18, 2013

Mapping a company

We’ve covered a lot of the basics about mapping but in this section, I’d like to cover the elements of building a map.

The elements of the map are the value chains of organization (which describe the organization) and the state of evolution of components (which describes change). Both these elements will need to be combined (see figure 47)

Figure 47 – Components of a Map.


Step 1 - How to write a value chain.
The value chain itself can be determined first by asking the question “what is the consumer need” and then determining the components and subcomponents required to meet that need.

For example, in the case of Fotango's photo service the user need was for an online service to store, modify and retrieve digital photos (the Fotango site). One these needs are known, the visible components of the service can be described from a web site, to image manipulation, to image storage to payment. Once visible components are determined then underlying components can be drawn from CRM to compute resource to power.

The best way of doing this, from practice, is to get a group of people together with some post-it notes and write down every consumer need. These should be placed on a huge whiteboard (ideally a wall) in fairly random order. It’s quite common for new unmet needs to be described at this point, don’t add them to the wall but instead take a note as these represent new opportunities.

Then for each need, using a different colour of post-it notes, the group should write down the top-level components that meet the need. From this list any subcomponents that the top-level component will use including any data or practices or activities should be written down. For each subcomponent further subcomponents should be identified until a point is reached that the subcomponents are outside of the scope of the company. For example power as a subcomponent doesn’t need to be broken down any further for a company that consumes power from a power company.

Hence for example, to store digital photos requires some sort of digital photo storage component that in turn requires compute resources, storage resources, an operating system, network, power etc. There is no need to break down an operating system further for most companies as this is something that is acquired from others.

These components will make the value chain and any component needs only to be written once. When the group is satisfied that the components for all needs have been written, then take the needs of the wall and discard them.

Now write on the wall, a single vertical line and mark it value chain. The top-level components should now be added to the wall at the top of the value chain and the subcomponents placed underneath with lines drawn between components to show how they are linked (see figure 48)

Figure 48 – Needs to Value Chain


More components maybe discovered during this process, they should added to post-it notes, added to the wall and links drawn. Once the group is satisfied that they’ve successfully described the value chain then take a picture of the wall and remove everything.

Step 2 - Adding Evolution
On the wall, now draw two lines - a vertical line for value chain and a horizontal line for evolution, marking on lines for genesis, custom built, product and commodity. Start to add the value chain that you previously created beginning with the top-level components. For each component the group should ask itself the question of how evolved is this activity?

In practice the best way to do this is to examine the characteristics of the component, hence ask yourselves:-
How ubiquitous and well defined is the component? 
Do all my competitors use such a component?
Is the component available as a product or a utility service?
Is this something new?

Once you’ve determined, add the component to wall, positioning it along the evolution axis in what the group agrees is the right place. Keep on repeating the process, moving down the value chain, drawing links between components as you go. What you’re aiming for is a map like the one shown in figure 49 (NB the map provided was used in Fotango in 2005, obviously the components have evolved since then)

Figure 49 – A Map


From experience, the writing of a map for a single value chain (area of customer need or line of business) starting from writing down the needs to finishing the map, should take between 30 minutes to an hour once you get the hang of it.

Step 3 - What to do next?
Once you have a map, write another. For every line of business that the company has then a map should be written. In this case, more is better.

Maps should then be compared for common components and a list created for what should be shared i.e. do we really need 15 different CRM systems or would one do? If there is a delta in how components are treated between maps, for example one group says CRM is a commodity but another says CRM should be a custom-built system then this needs to be challenged and the question “why?” asked.

Often it is the case that where there is disagreement over a component then it can be broken into two or more subcomponents, many of which are actually commodity. Alternatively it can be a simple case of inertia. It’s not uncommon for companies to mistreat components (whether activities, data or practices) and to overspend on customizing something that should really be a commodity. Where there’s just a plain disagreement between groups on an identical component always treat it as the more evolved. These deltas are useful in determining areas of efficiency, so keep a note of them.

With enough maps, you should now have an idea of what should be shared components across business, new opportunities and areas of efficiency to investigate. Given a company with say forty different value chains of reasonable size, even if you assign a small group to do this in a serial fashion it should take around a week to complete.

Once you have the maps, I’d recommend sending one team to examine the opportunities, shared components and areas of efficiency whilst you turn your attention to look at the components in more detail.

---

Post 20 on the Management and Strategy series.


Previous post in series ... Openness vs Strategy

Beginning of the Management and Strategy series ... There must be some way out of here


The Journey so far ...

We now have all the basics to start mapping companies and playing the strategy game after which we will look into more advanced defensive and attacking strategies combined with various dark arts.

BUT before I go into the details of how to map a company and start to play the strategic game, I thought I'd recap on all the basics we have covered. These are essential for understanding the rest of the journey.

And, so with no more egging of the custard ...

---- The journey so far.

Post 1 : The start of my journey
A young CEO caught in the headlights of change.
http://blog.gardeviance.org/2013/01/there-must-be-some-way-out-of-here-said.html

Post 2 : The importance of maps 
An exploration of why maps are important and a question - where are our business maps?
http://blog.gardeviance.org/2013/01/the-importance-of-maps.html

Post 3 : There's too much confusion. 
My quest for maps in business begins in earnest and starts with the concept of value chains.
http://blog.gardeviance.org/2013/01/theres-too-much-confusion.html

Post 4 : Evolution, 
Explores how things evolve and why diffusion is only part of the puzzle. Evolution is an essential part to mapping an organisation.
http://blog.gardeviance.org/2013/01/evolution.html

Post 5 : A first map. 
Uses both value chain and evolution to create a rudimentary map of a business. In this case, Fotango in 2005.
http://blog.gardeviance.org/2013/01/a-first-map.html

Post 6 : Business they drink my wine
The journey from chaotic to linear and how the characteristics of activities, practices and data change as they evolve.
http://blog.gardeviance.org/2013/01/businessmen-they-drink-my-wine.html

Post 7 : Why one size never fits all
Examines why the change of characteristics impact techniques and how one technique is not suitable for all activities leading to debates such as six sigma vs agile
http://blog.gardeviance.org/2013/01/why-one-size-never-fits-all.html

Post 8 : Of perils and Alignment
Examines why changing characteristics create problems for business from the pitfalls and perils of outsourcing to the issues of business alignment.
http://blog.gardeviance.org/2013/01/of-perils-and-alignment.html

Post 9 : Everything Evolves.
Explores the common path of evolution whether Practice, Activites or Data and how practices can co-evolve to create inertia to change. Covers Cynefin, Co-Evolution and Inertia
http://blog.gardeviance.org/2013/01/everything-evolves.html

Post 10 : Evolution begets Genesis begets Evolution
Examining how there is a cycle of commoditisation and genesis with new activities being built on past activities. Covers componentisation, volume effects and disruption,
http://blog.gardeviance.org/2013/01/evolution-begets-genesis-begets.html

Post 11 : Inertia
Examining why customers and companies have inertia to change, what the causes and symptoms are and why it is so dangerous. Covers disruption of the past, transition to new and agency of the new.
http://blog.gardeviance.org/2013/01/intertia.html

Post 12 : Revolution
Using evolution and inertia we explore why revolutions (such as the industrial revolution) occur and what the common consequences of this are. Covers Kondratiev waves, prediction and time, disruption.
http://blog.gardeviance.org/2013/01/revolution.html

Post 13 : Revisiting our first map
Taking the lessons and principles we've covered and re-applying them to that first map of Fotango back in 2005, to explain how Fotango predicted the changes brought about by Cloud.
http://blog.gardeviance.org/2013/01/revisiting-our-map_17.html

Post 14 : No Reason to get excited
Using the mapping technique we explore the cycle of change and how we move through states of peace, war and wonder.
http://blog.gardeviance.org/2013/01/no-reason-to-get-excited.html

Post 15 : The Next Generation
We expand the constant cycle of change to look at macroeconomic cycles, how new organisations form and what the current Next Generation (the new Fords) looks like.
http://blog.gardeviance.org/2013/01/the-next-generation.html

Post 16 : Ecosystems

On of the techniques used by the next generation is ecosystem. We examine the different types of ecosystems, models like ILC (innovate - leverage - commoditise) and why they are powerful tools
http://blog.gardeviance.org/2013/01/ecosystems.html

Post 17 : Open
Another characteristics of the Next Generation is in their use of open technologies, here we explore the general effects of Open.
http://blog.gardeviance.org/2013/02/open.html

Post 18 : Openness, Innovation and Maps
We dive a bit deeper into the effects of open approaches and start to consider some of the gameplay in the wild.
http://blog.gardeviance.org/2013/02/openness-innovation-and-maps.html

Post 19 : Openness vs Strategy
In this section we explore what matters more - Openness or Strategy? We categorise companies into Players, Thinkers, Believers and Chancers and explain why mapping is important to company health.
http://blog.gardeviance.org/2013/02/openness-vs-strategy.html

Now, at long last ... I can finally start to make the subject interesting and applicable.

Openness vs Strategy

Most companies today consume open technology and many have some form of open technology policy on whether they open technology. This is not just related to the software industry, from Banking (Deutsche Bank’s Lodestone project) to Governments (Department of Veterans Affairs with VistA), the provision of open technology is quite widespread.

In interviews and surveys with over 160 different companies back in 2012, we found similarities and differences  between companies and their approach to open technology particularly when those companies were categorized into groups of Traditional Vs Web 2.0.  For example, both groups had formal processes for opening technology and were unwilling to open a source of competitive advantage. Figure 43 provides the percentage of companies within a particularly group (Traditional or Web 2.0) responding to a particular question (from strongly disagree to strongly agree)

Figure 43 - Unwillingness to Open a source of competitive advantage.


However, when it comes to providing open technology in order to compete
 with others, there is a marked difference between the two populations. (see figure 44)

Figure 44 - Use of Open as a means to compete


This at first appears odd. If both groups consumed open technology and both groups were similar in having formal process for open technology, why would one group be more willing to use open technology as a means of competing? Examination on market cap revealed similar sized groups, so this wasn’t just a question of whether one group was start-ups. Something else was a foot.

After further investigation, it turned out the difference was strategy or more specifically the ability of the company to consider its own and competitor’s value chains in formulating strategy. A large group of the Web 2.0 had some means of modeling the environment, even if this was just a mental model rather than a map. They would consider the impact of open on this model. They appeared to exhibit a higher level of strategic play. This same group also exhibited characteristics of Next Generation companies (i.e. the set of characteristics which we determined in 2011 as indicating the next evolution of organisations).

Hence, the LEF examined the level of strategic play (i.e. consideration of own and competitor’s value chains in determining strategy) against the willingness to use open as a means of competing.  The results are provided in figure 45 which a form of heat map where the size of the bubbles represents the number of companies involved, categorized by whether they were more Traditional or more Web 2.0.

The axes are:-

Level of Strategic Play is an index derived from a set of questions covering understanding and consideration of own and competitor's value chains in determining strategy.

Uses Open to Compete is an index derived from a set of questions covering the willingness of a company to use open as a means of competition (whether open source, API, data or other) both in terms  of statement of intent and actual action.

Figure 45 - Level of Strategic Play vs Willingness to Use Open


You can consider one axis the level of strategic thought, the other axis a willingness to execute and act on this with an appropriate tool. On examining sizes of companies and changes in market cap over the last seven years we then categorized four different sections of the graph (see figure 46) with each section containing a general type of company – Players, Thinkers, Believers and Chancers.

Figure 46 -  Players, Thinkers, Believers and Chancers


A description of the characteristics of each type is as follows: -

• PlayersThese organizations use open technology where appropriate as a means to compete and think clearly about its impact on their value chains and those of competitors – in other words they think strategically and act. This group shows a high affinity for the more advanced strategic plays (undermining competitors barriers to entry, removing points of differentiation, protecting existing value chains and recruitment) and is dominated by organizations identifying themselves as ‘Web 2.0’. They tend to be large firms and market leaders in their respective segments with strong market cap growth over the last seven years. They are neither “open” nor “proprietary” companies but a blend of both and they tend to exhibit many of the characteristics of the Next Generation of companies.

Thinkers: While these organizations tend not to use open technology as a means to compete, they do consider the impact on their value chains and those of competitors. This group appears to understand the game but chooses not to engage seriously now – in other words, they think strategically but don’t act. It includes Web 2.0 and Traditional medium- and large-sized firms. They show moderate changes in market cap over the last seven years and tend to exhibit a few of the characteristics of the Next Generation of companies. Many of these companies tend to be “proprietary” in nature rather than mixed.

Believers: This group uses open technology as a means of competing but does not show any affinity for strategic play – in other words they act but don’t tend to think strategically. Their attitude tends to be one of ‘open by default’ and they are just as likely to reduce a barrier to entry into their own business as to create an advantage over others. This group is more “open” in nature and is far more willing than the general population to open up sources of differential advantage. They tend to be smaller firms, often start-ups with mixed fortunes. They tend to exhibit some of the characteristics of the Next Generation of companies.

Chancers: This group neither uses open technology as a means of competing nor shows any affinity for strategic play – in other words they neither think strategically nor do they act. Whilst they often know their competitors are using these strategies against them, they do little in these areas other than basic consumption. Traditional companies and market laggards mainly populate this group, with poor and negative market cap growth. They exhibit almost none of the characteristics of the Next Generation and tend to be “proprietary” in nature.

In terms of market cap change, what the results showed clearly was the importance of strategic play (thinking) over use of open as a competitive tool (acting) i.e. it’s better to be a Player or a Thinker than a Believer or a Chancer. The strongest performing group were the Players who do both and these companies also exhibited the most Next Generation characteristics. The weakest performing group were the Chancers who also exhibited the most Traditional characteristics.

The are two things to emphasize.  First, having an understanding of the landscape, how it is changing, where your opponents are and good situational awareness (i.e. high levels of strategic play) tends to be far more important for a company’s health than simply acting (as in competing with open). Yes, 'open' can be a powerful weapon in the hands of an experienced strategist but that strategist needs to know the landscape before they fire. This is why Maps are so important.

The second thing to note is that not only are organisations evolving (from Traditional to Next Generation) but those  more evolved companies also appear to be playing the more strategic game. That's sort of a double whammy. They have more evolved structures and more strategic executives than their competitors.

---

Post 19 of 200 on the Management and Strategy series.

Next post in series ... Mapping a Company

Previous post in series ... Openness, Innovation and Maps

Beginning of the Management and Strategy series ... There must be some way out of here


Openness, Innovation and Maps.

In an examination of the 500 most active open-source projects, Krzysztof Klincewicz calculated that 99 percent of them focused on an existing technology or modification for a new market whilst only 1 percent represented the creation of a genuinely new idea i.e. the rates of genesis are little or no different to proprietary approaches.

BUT, since evolution results in the development of new low-cost building blocks (components), it does increase the genesis of higher-order systems as a secondary effect, and open technologies are seen to substantially increase “innovation” overall by providing platforms on which the novel and new is created. 

An example would be the Apache Web Server that has, by providing a low-cost building block (component) for web serving, accelerated the genesis of higher-order systems such as web sites. In effect, Apache has provided a ‘platform
 for web innovation’. 

However, there is little difference between open vs proprietary approaches on those higher order systems that are created with this component and many “innovative” web sites are proprietary despite consuming underlying open components. Naturally, the use of an ‘open’ approach will drive the new higher order system rapidly to a more evolved state.

Hence an ‘open’ approach is not associated with increased rates of genesis for an activity but instead rapid evolution including feature completeness (through collaboration), market adoption (through reduced barriers to adoption) and genesis of higher order systems (a ‘platform for innovation’).

The problem with the term ‘innovation’ is that it is used to mean all of these things. An open approach enables some forms of 'innovation' (product, market and genesis of higher order systems through a platform) but does not make any significant impact on other forms of 'innovation' (i.e. the genesis of an activity).

If we look at our map, the effect of open can be more clearly seen and how driving an activity to a more evolved state along with efficiency can result in rapid generation of higher order systems (see figure 41)

Figure 41 Mapping view of Open’s impact


However, there is more to open technology than just this. Open technology approaches can be used to solve semantic interoperability issues by creating a standard and in turn can enable competitive markets of suppliers, associated exchanges and assurance industries. By driving evolution it can also be used to undermine a competitors barrier to entry or remove a differential a competitor may have. ‘Open’ can be used as a powerful recruitment tool, a negotiation tool or to circumnavigate an existing obstacle such as purchasing procedures. It can even be used to protect an existing value chain. 

Google’s core business is based upon its data value chain. It accesses data from many sources and then uses it to more accurately sell advertising space associated with specific words and actions. The company seeks to expand
into just about any market where data can be modeled to its advantage. Dominating the data value chain, the algorithms to model the data and the systems needed to run the algorithms are all critical to Google’s success and highly proprietary. While Google has been heavily involved in open technology and enabled ecosystems to flourish on its APIs, Google’s core systems and algorithms are guarded secrets. In general, Google uses open approaches when they help keep the data flowing.

The rapid growth of smart phones posed a threat to Google’s business. The iPhone’s dominance meant that a significant part of the data value chain
was being locked away in a ‘walled garden’. But by not open-sourcing iOS, Apple exposed itself to a counter-play around a common mobile OS and an ecosystem of hardware manufacturers. This is what Google’s Android has achieved, gaining the majority of the global unit market share, although Apple still makes the great bulk of the profits.

As with other ecosystems, this market benefits from higher rates of “innovation” over a single supplier. Apple, a company that once could have been thought of as leading the pack, today increasingly looks like a fast follower.

Whilst Android can be seen as a highly successful counter through open technology, it’s governed and developed through a company-controlled process. Google uses its Compatibility Test Suite (CTS) to ensure interoperability of devices and limit a collective prisoner’s dilemma scenario, where members of the Open Handset Alliance (OHA) all differentiate and thus weaken the core. CTS is behind the current Acer vs. Google row in China over Acer’s plans to offer a ‘forked’ version of the Android platform for the Chinese market. However success in limiting one threat to Google’s data value chain has also created a new and probably unanticipated threat as Amazon has taken Android and used it to create another ‘walled garden’ based on tablets: the Kindle Fire.

At the same time as this one battle is occurring, Facebook’s open technology project on building large data centres (known as open compute) can be simultaneously seen as driving efficiency, a tool for negotiation with its own suppliers and a means of weakening any company that depends upon highly efficient data centres as a barrier to entry into its own business. One such company is Google (see figure 42).

Figure 42 Playing the Game with Open Technology


The point to note is that open technology approaches can be used for more than just building a platform or encouraging efficiency. One question we should be asking is who actually thinks in these terms?


---

Post 18 of 200 on the Management and Strategy series.

Next post in series ... Openness vs Strategy

Previous post in series ... Open

Beginning of the Management and Strategy series ... There must be some way out of here


Open

When Linus Torvalds launched the Linux project in 1991, few people could have imagined that free software developed by open communities would ever match, let alone surpass, the efforts of industry giants such as IBM and Microsoft. Yet in a wide range of areas this has been precisely the case.

The full market value of this open technology is however impossible to calculate because it is not formally accounted for. How can we measure the value of Wikipedia’s commons of open content?  In one study by O’Reilly Media, the global value of open source to just the computer hosting market was estimated at over $100 billion, and this 
is only a part of the overall open technology industry. According to the Black Duck Research, there are over 600,000 open software projects using over 100 billion lines of code and drawing on 10 million person-years of effort. 

Studies have also shown that roughly
 90% of large organizations already use open source (and the rest probably don’t realize that they do) and 75 percent of the world’s top 10,000 websites are built on open-source technology. Whichever way you look, open technologies are having a powerful impact.

Along with these extraordinary achievements, it has also long been speculated that the ‘open’ meme would eventually spread to non-IT sectors. There are three main reasons why this was likely. First, software has become increasingly important in virtually every industry, and thus it seems logical that the dynamics of the software industry would spread to other sectors. Second, as the Internet is now the backbone of most modern businesses, much more open forms of community innovation are now possible in just about every industry. Third, cost and innovation pressures are now so great in so many sectors that new approaches must increasingly be considered.

While these forces have existed for some time, it appears that open approaches are now starting to become widespread across the broader economy. In addition to many open source software projects, we have recently seen a growing emphasis in universities on open science and open curricula; increasing government commitments to open data; and perhaps most intriguingly, impressive demonstrations of the power of open- manufacturing designs when combined with 3D printing. There is now ‘open’ activity at virtually every level of business and IT.

However, for many, the word ‘open’ as in ‘open source’ still conjures up concepts of hippy idealism where
people give away their work to others for nothing in a spirit of generosity and passion. In today’s world, this view is increasingly naive. An open approach is a powerful weapon in the hands of experienced strategists. It can be used to remove barriers to entry into an opponent’s business, encourage standardization around your own practice, develop an ecosystem to strengthen your position, as part of a land grab for new sources of value, and even as a source of new talent. 

I use the term open technology above because these ‘open’ approaches are not limited to open-source software but also open data, open hardware, APIs, open science and open processes.

But how did something that began two decades ago with a simple bulletin board message inviting people to collaborate on operating system project have such a powerful and transformative impact? 

It is essential to understand that when Linus Torvalds posted that message he asked others to contribute and comment. By doing so, Torvalds created
a community of contributors and launched a new ‘open’ method of community development.

The key is not only the openness of what is created (in terms of licensing of the code or data) but also the collaborative approaches to working. These two aspects when combined drive the evolution of any activity, practice or data. The openness drives ubiquity by removing barriers to adoption, the collaborative working drives feature completeness, understanding and hence certainty (see figure 40).

Figure 40 Impact of Open


The consequences of evolution should by now be familiar to the reader. As anything evolves it becomes more efficient and can enable rapid development of higher order systems through componentization effects. Hence the effects of making something open are four fold – rapid adoption, improved feature completeness, higher efficiency and rapid genesis of higher order systems.

Whilst these are entirely separate effects, they are often lumped together under the single term innovation, such as product innovation (feature completeness), marketing innovation (adoption) and the genuine creation of something novel and new (i.e. genesis). It’s worth keeping these separate and I’ll explain why in the next section.

---

Post 17 of 200 on the Management and Strategy series.

Next post in series ... Openness, Innovation and Mapping

Previous post in series ...  Ecosystems

Beginning of the Management and Strategy series ... There must be some way out of here


Friday, February 01, 2013

Something Shocking

This morning I was reading Glyn Moody's piece on the potentially huge FCO contract for Oracle.

I was pretty stunned by this, having as with many others seen the recent praise of Government IT by the NAO (National Audit Office), the praise of UK Gov IT by Tim O'Reilly and the reforms being undertaken. This felt like a huge step backwards though there maybe more to the story.

Just reading the story as is (and hence with none of the background) you could be forgiven in thinking the FCO has just stuck up two fingers to Francis Maude, The Cabinet Office, Government IT Strategy, The Austerity Agenda, George Osborne and the Treasury. Pretty shocking.

However, it wasn't the most shocking thing I heard this week.

During a session at Cloud Expo Europe (which was an excellent conference, outstanding as always and not to be confused with SYS-Con's vendor fest), another tale of IT horror in procurement appeared. This one floored me, so to speak.

The accusation was that a particular large company had transferred a highly expensive system (think lots and lots of millions) from one vendor to another not because of some real strategic reasoning but instead for the reason of CV boosting i.e. the CIO was leaving and wanted the vendor's name on his CV.

My initial reaction was this is just a joke, So, I tweeted this and received a flood of messaging from various sources all giving similar stories - "I saw a CIO force a massive contract and implementation entirely for such personal-reputation reasons".

You are kidding?

So I thought I'd put together a very quick survey which I'd run this evening and see what happened. The results will be published here.

RESULTS

First of all, a huge thank you for all those replying. I had 41 responses this evening and whilst this is an extremely small sample which may well be a biased, it does make interesting reading.

The graphs are as follows:-

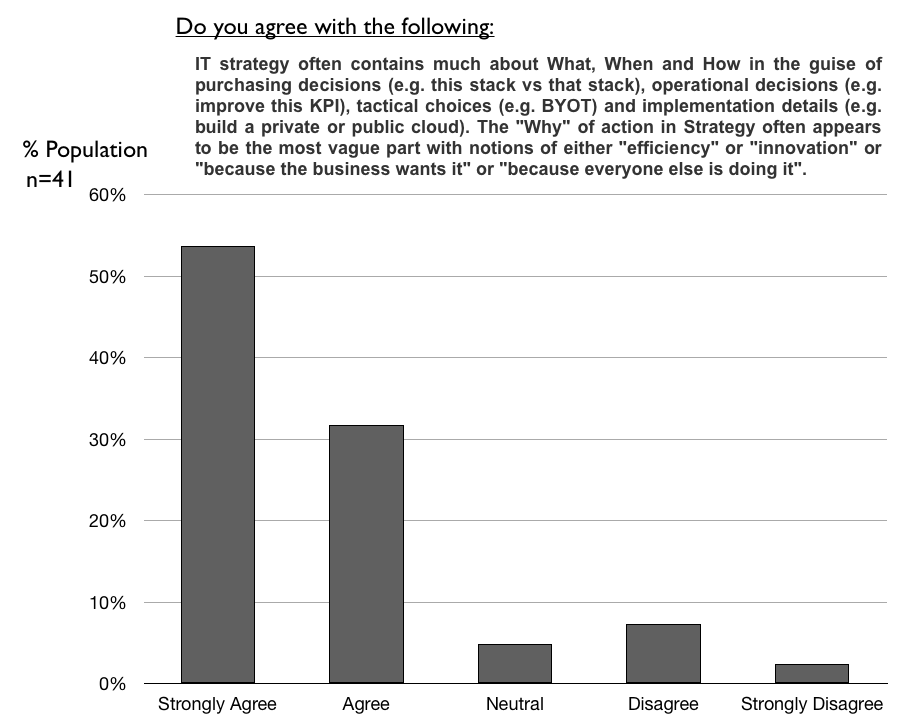
Survey 1 - The question of Why in IT Strategy

This question asked whether you agreed that most IT strategy contains much about what, when and how but the why of action (the "real" strategy part) often appears vague and depends upon notions such as others are doing it or the business wants it. 85% of respondents agreed or strongly agreed with the statement provided.


Survey 2 - The question of CV boosting

This question examined whether the reason "Why" some purchasing decisions were made had nothing to do with strategy but instead were due to personal self interest such as boosting a CV with new skills. A quite shocking 73% of respondents agreed or strongly agreed with the statement. If this was actually representative of the industry, it would imply that an awful lot of technology investment is suspect.


Survey 3 - The question of influence.

The question examined how much "the business wants it", "other companies are doing it" or "CV boosting" impacts  IT purchasing decisions. Respondents indicated whether each of these factors impacted 0% of IT purchasing decisions or one of several bands (1-25%, 26-50% etc).

Interestingly over 60% of respondents indicated that "Other companies are doing it" impacted 50% or more of all IT purchasing decisions. Which implies that case studies must have quite a significant impact on choice and there's a strong "follow everyone else" mentality.

40% of the respondents view that "the business wants it" impacts 26% to 50% of IT purchasing decisions whilst 45% view it as impacting 50% or more of IT purchasing decisions. Hence implying the  business has a strong influence in what IT buys.

As for CV boosting, 44% of respondents indicated it impacted somewhere between 1% to 25% of all IT purchasing decisions whilst over 48% indicated it impacted 25% or more of all IT purchasing decisions. This would imply (if the sample is representative) that the practice is far more widespread than I had originally thought. Perhaps, I was very naive to be shocked by a CIO spending millions of a company's financial capital in order to make their CV look good.


Now, as I've said, this was an extremely small sample, it may well be affected by sample bias and the survey was very rough and ready. However, it does seem to warrant further investigation.

The reason for further investigation is the survey implies (if it is representative, which it may well not be) that much of IT strategy is anything but strategy and that purchasing decisions are being influenced by the business, what others are doing and self interest.

This is a far cry from the use of IT as a competitive and strategic weapon which is exhibited in some companies.