Thursday, June 29, 2023

INTRODUCTION

Over the last 15 months, I've been working on a research project with many volunteers to map different industries. This has been an exercise in exploration.

Most of us are familiar with using maps to apply appropriate methods, whether project management o finance. We're equally familiar with how to challenge what is being done or to find areas where we need to concentrate on efficiency or innovation or customer focus. But how do you map an industry? Which maps right? How do you find what is or maybe important?

The research has covered twelve industries and two technology sectors so far with over 300 volunteers (including 220+ involved in the primary research). Those volunteers have been from across the globe all working openly using zoom, miro and maps. I'm incredibly grateful for the effort that has been put in, and I thank you for all that was done.

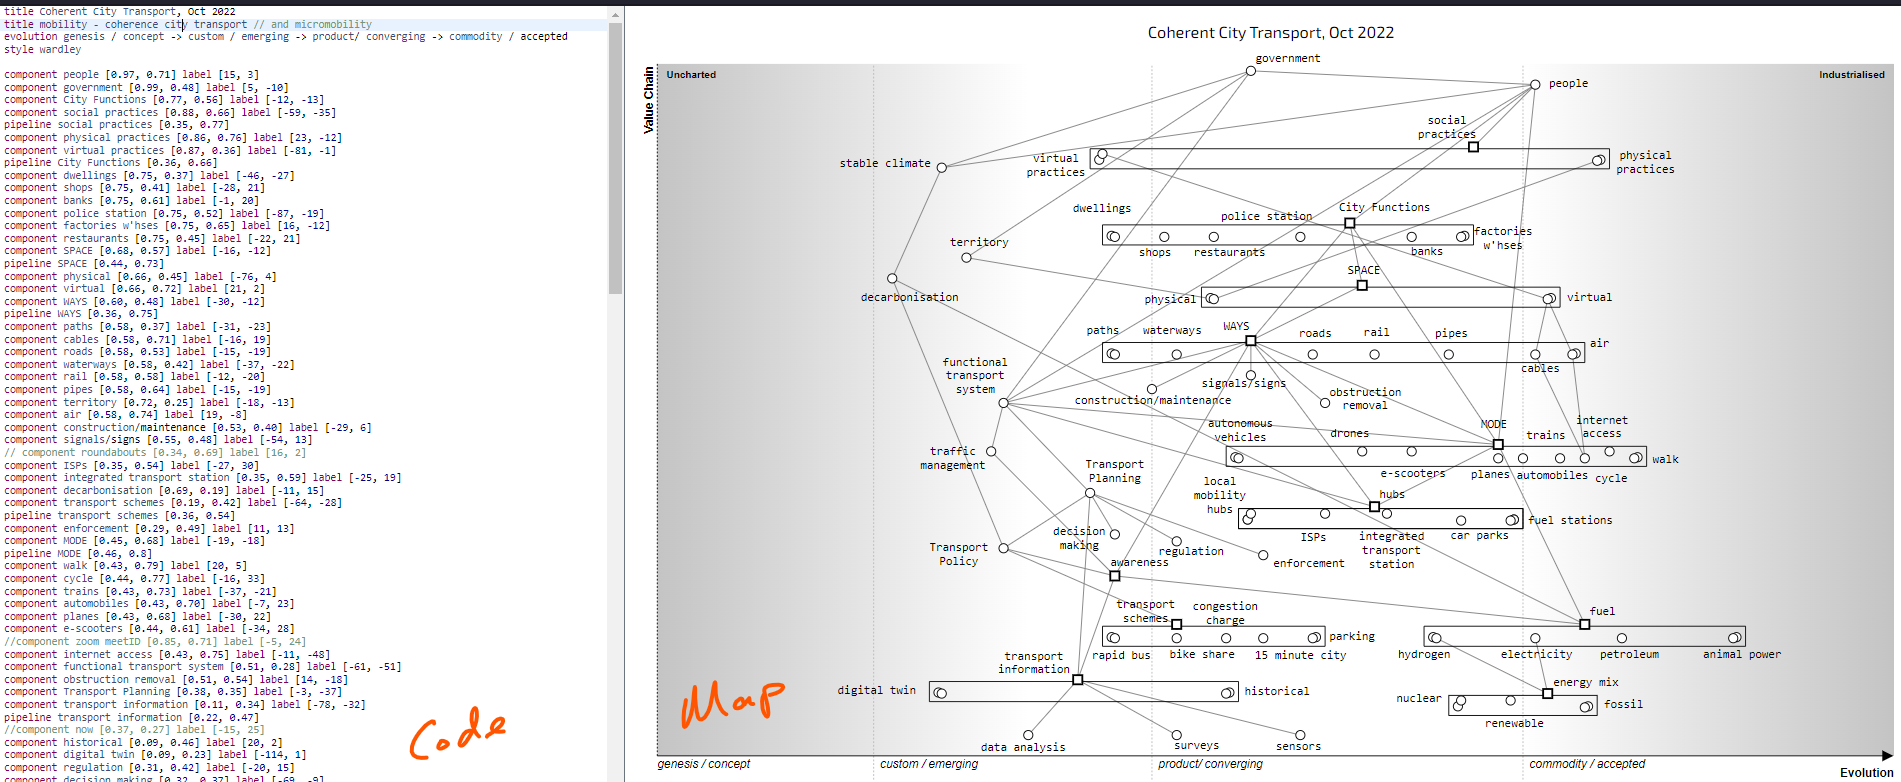
In the next series of posts, I'm going to share the raw reports that we've written, including the maps and the process used. If you use online wardley maps then you'll also find the code in my github - https://github.com/swardley/Research2022

A more polished version of these reports will be available on the DXC Leading Edge site and I'll provide a link to that when they are completed.

The industries covered include retail, manufacturing, construction, defence, transportation, healthcare, government, education, finance, agriculture, energy and telecoms.

The technology sectors include AI and Cybersecurity. Though we have new sessions coming up on sustainability, gaming, the future of workplace and even quantum computing. This project is very much ongoing.


REPORT -  RETAIL

1. THE FUTURE OF RETAIL IS AT A CROSSROADS
On one hand, retail faces several challenges including the rise of e-commerce, the need to improve sustainability, and the increasing demands of consumers for transparency. On the other hand, there are also several opportunities for retailers to thrive, such as the growth of omnichannel retailing and the increasing use of data analytics to refine customer journeys. Given this, where should we focus our investment?

In this evolving landscape, one set of emerging and critical issues facing the retail industry are integrity and transparency. In recent years, there have been several high-profile scandals involving retailers, such as the use of child or slave labour and the sale of counterfeit goods[1]. These scandals have eroded consumer trust[2] and made it clear that retailers need to do more to ensure that their supply chains and their practices are ethical and sustainable. Unfortunately, we have future potential scandals heading our way, from low pay to misuse of BNPL[3] (buy-now-pay-later) and EWA[4] (earned-wages-access). One area we should focus on is the need to act with integrity and transparency, avoiding spin and admitting mistakes when they happen.

Another issue facing the retail industry concerns collaboration. To meet the demands of consumers and stay ahead of the competition, retailers need to share information and work together. However, despite early efforts such as Open Supply Hub[5], there is often a reluctance to share information, as retailers fear their competitors will benefit from it. Our second area of focus is the need to dare to share and as RILA[6] states “collaboration makes retailers better competitors”.

Finally, the industry requires metrics that drive sustainable choices. That’s not to say we don’t have metrics; we have lots of them. Unfortunately, due to the complexity of supply chains and a lack of transparency, there is a heavy reliance on estimation. The industry is “woefully behind on scope three targets”[7] which can account for 90% of emissions. Our third area of focus for retailers is the need to make use of meaningful metrics that reflect the true impact of their operations on the environment and society, including using more scientific and data-driven metrics that can accurately measure things like carbon emissions, water use, and waste production.  Unfortunately, according to a 2022 CDP study[8], less than 35% of companies’ emission reduction targets are credible.

Whilst integrity, sharing and meaningful metrics might sound a bit soft in the rough and tumble of commerce, a 2021 study[9] by Avery Dennison suggests that consumers want transparency in their supply chain, and a 2019[10] study by the World Economic Forum highlighted that leaders are often operating blind and less capable of managing shocks to the system. These “soft” issues have material impacts.  

The three key messages, challenges and actions are summarised in the following 6-box. The rest of this report will discuss how they were determined and why they are considered priorities.

Figure 1 – The six boxes.


2. EXPLORING THE WORLD OF RETAIL

In 2022, DXC Leading Edge brought together a team of 226 volunteers to explore 12 different industries. Thirteen of the group chose to explore what mattered for the future of retail. This “retail” team had a wide variety of experience in the retail sector, from senior leadership of large global conglomerates to startup founders. Our initial problem, as with all the groups, is that we started with no agreed method to explore the future. The exploration process emerged during the research project through the interactions of all the teams. That process involved the following steps.


2.1 Collect words.
To begin with, the group created a cloud of words that they felt were important to the future of retail. This varied from loyalty programs to last-mile delivery, from virtualisation of goods to influencers (see Figure 2.1). There was no initial consensus.

Figure 2.1 – the cloud of words related to the future of retail.


2.2. Categorise.
The words the group created were often connected with each other. Consumer transportation, driverless cars and electric scooters have a relationship around mobility. The team explored those relationships and created a graph of the space connecting each word to a theme (see Figure 2.2).

Figure 2.2 – the categorisation of words into themes.


The team then chose three themes they wished to explore: sustainability, shopping (an expansion on virtual shopping) and logistics. The chosen themes would become our perspectives from which to map retail.


2.3 – Mapping
The group mapped[11] each of the three chosen perspectives of retail, starting with concepts of user need, the components involved, and how evolved the components were. The maps were continually refined until the group considered the map was good enough to describe the space. On average this would take 6-14 hours per map. For illustrative purposes, one map on the perspective of shopping is given in Figure 2.3. The remaining maps on sustainability and logistics are provided in the appendix.

Figure 2.3 – Retail Map from the Perspective of Shopping.


Several aspects of the map were highlighted, including:-

1) how virtual stores allowed for a much greater industrialisation than physical stores.

2) how channels depend upon the choice of spaces (physical, virtual or both) and the experience that we create with them.

3) how space is connected to social practices, i.e., we’ve learned how to operate and interact with others in different physical spaces, but many are just learning the techniques required in the virtual space.


2.4 Analysis
For each of the three maps, areas where an organisation may choose to invest were highlighted. Once the list was considered reasonably exhaustive, the group identified for each map a few high-priority areas (see Figure 2.4). In the case of shopping, the high-priority areas were data analytics (specifically associated with the customer journey), emerging virtual practices (the social practices by which we interact with others) and integrity.

As one of the retail team commented, “mapping out the space helped us [the retail team] to think deeply about the chosen perspective and what needed to change in ways we hadn’t considered before”.

Figure 2.4 – Retail Map from the perspective of shopping, including investment areas.


The reason for using multiple perspectives is that it would enable us to aggregate importance across various maps. This is the real magic of the technique. For the reader, imagine a world where no previous maps exist. You’ve just received the first-ever maps of Paris created by three different groups. How do you know which map is correct? How do you know what landmarks are important? You look at a single map and it highlights the Eiffel Tower and Pierre’s Pizza Parlour but which is more important? You’ve never been to Paris.

By asking multiple cartographers to highlight essential features on their maps and then aggregating across them then you are more likely to find the important landmarks regardless of perspective. In the Paris example, you’ll quickly find that the Eiffel Tower is a familiar landmark across many maps compared to Pierre’s Pizza Parlour which may only appear on one.

This is precisely what we are doing: creating three perspectives and consolidating across them in an attempt to find the landmarks that matter.


2.5    Consolidation to important landmarks.
First, we aggregate across the maps , creating a priority order based on the frequency at which an area (for example “virtual goods”) is highlighted and any priority given. In the case of retail, those areas of highest priority across all maps included: - awareness of the supply chain (high), integrity (high), data analytics (focused on customer journeys), sustainability, measurement, emerging virtual practices and distribution (of storage and inventory). This order was then compared against the aggregated results of 14 analyst reports as well as comparison to ChatGPT-4 and BARD. See figure 2.5

Figure 2.5 – Consolidation and comparison to Analysts, ChatGPT-4 and BARD.


2.6 Discussion
By examination of Figure 2.5, a number of observations are made.

1) The difference between the views of analysts and those of the retail team are so wide that you can say that retail is standing at a crossroad. On one hand the analysts would have you follow a path focused on personalisation (high) and data analytics (high). The retail team would have you follow a path of awareness of the supply chain (high) and integrity (high).

2) ChatGPT and BARD had high levels of agreement between themselves along with a tendency to agree with the analysts. As large language models trained on relatively recent text, the priority order created by ChatGPT-4 and BARD should statistically reflect how common the terms appeared in common text i.e. whether analysts and others were writing about it. Hence, you would expect some level of consensus. Volatility between ChatGPT-4, BARD and the analysts would imply high levels of uncertainty in the field. Care must be taken to use prompts that forced both LLMs (large language models) to stick to sorting the given list rather than answering the question of what matters. One notable variation is the LLMS tended to agree more with the retail team on the issue of supply chain awareness.

3) The retail team’s priority order tended to have words that were implied from (rather than being identical) to those that the team originally collected (figure 2.1.) For example, the phrases “carbon footprint of global supply chains”, “resilience versus robustness of supply chains” and “Who in the supply chain is held to account” implies an “awareness of supply chain” which emerged during the mapping process as being the highest priority focus.  

4) The priority order represents a general consensus between the team. Obviously, the actual priority order for a retail company will depend upon its context. Two areas with strong consensus for the retail team were how poorly understood supply chains were and integrity. Poor awareness of the supply chain has an impact on other topics from resilience to crisis management to sustainability. A lack of integrity in the industry creates a history of scandals, from the use of slave labour to fraud to poor wages. Two current trends that were highlighted and felt likely to cause future scandals were BNPL (Buy Now Pay Later) and EWA (Earned Wages Access). The former, which allows retail to arrange bank loans for purchases seems to be a very positive change on the surface, with retailers increasing revenue (any loan interest paid as the product discount), banks receiving interest (the loans are packaged into collateralised obligations which are sold to other markets) and consumers receiving products they want (with interest-free loans). Unfortunately, such schemes have been used to buy staple goods, and the concern is the creation of a new debt bubble with retail at heart. The latter, EWA, again seems optimistic, allowing employees to gain access to earned wages and avoid using payday loans. In effect, however, this is an interest-free payday loan, and the group highlighted how this was not solving the fundamental problem of low wages and could instead create entrapment.

Based upon the maps created, the areas highlighted for investment, the consolidation of these areas to form a priority list and comparison to analysts, and the subsequent discussion, the following six boxes were created (a repetition of the previous Figure 1)

Figure 2.6 – Six Box.


2.7 Leading practice
During the research process, several companies were highlighted for what the group considered leading practice. A selection is provided as a guide for the reader.

  • Deforestation-free supply chain by Unilver[12]. In particular the focus on using crowdsourcing
  • B Corp certification[13]. For completeness of the entire process.

  • 100% slave free the norm in chocolate by Chocolonely[14]. For clarity of purpose and focus on awareness.

  • A coalition for collective action by Sustainable Apparel Coalition[15]. For collective action and sharing

  • Explore global supply chain data by Open Supply Hub[16]. For collective action and sharing

  • Supply chain: going beyond compliance by Levis Strauss & Co[17]. For exceptional honesty and transparency in the complexity of supply chains

  • AWS Supply Chain Features by AWS[18]. For breadth of vision and provision of core components.

  • Provenance[19]. For provision of mechanisms to clarify claims made by retailers.

  • Retail Net Zero action plan by WRAP and WWF[20]. For collective action and focus on standardising measures.

  • Activism by Patagonia[21]. For direct action and integrity.


3 PROCESS
The complete process of determining the six box, starting with the collection of words to categorisation to mapping to analysis to consolidation and finally synthesis is shown in Figure 3.

Figure 3 – the complete method.


Whilst the method enabled us to determine a different view for retail, it is likely affected by the number of perspectives used. In this case, three were used and hence and the result can only be considered relevant to those three perspectives. As more perspectives are added, a more accurate picture of what matters in an industry should be generated.

The process is relatively time-consuming: -
  • Collection of words: 1 hour
  • Categorisation of words and selection of perspectives: 1 hour
  • Mapping of perspectives: 6 – 14 hours per map.
  • Analysis of map and selection of priority areas: 2-3 hours.
  • Consolidation and comparison: 2-3 hours
  • Synthesis: 3-4 hours.
The entire process can take 15-26 hours, assuming any mapping work is done in parallel.

Further studies intend to examine the validity of this process. Whilst it enables us to find a different view on what we should be investing in, whether that view is more accurate than simply listening to analysts remained unanswered.


4 NOTES
The research was completed with the aid of over 226 volunteers and hence all maps and analysis are provided as creative commons share alike. This includes the research process itself.


5 APPENDIX

Figure 5.1 – Retail Map from the perspective of logistics


Figure 5.2 – Retail Map from the perspective of logistics, including investment areas.


Figure 5.3 – Retail Map from the perspective of sustainability


Figure 5.4 – Retail Map from the perspective of sustainability, including investment areas.


6 REFERENCES

  [1] "We have lost a lot of control", Guardian UK, 16/04/03, https://www.theguardian.com/world/2023/apr/16/uk-at-risk-of-food-safety-expert-warns [RETRIEVED 29/06/23]
  [2] Retail has a customer trust problem. RetailWire, 22/02/03, https://retailwire.com/discussion/retail-has-a-customer-trust-problem/ [RETRIEVED 29/06/23]
  [3] Buy now, pay later schemes increasingly an avenue for financial abuse, Guardian UK, 15/11/22, https://www.theguardian.com/business/2022/nov/15/buy-now-pay-later-bnpl-schemes-financial-abuse-report [RETRIEVED 29/06/23]
  [4] EARNED WAGE ACCESS AND THE END OF PAYDAY LENDING, Boston University Law Review, Vol 101:705, https://www.bu.edu/bulawreview/files/2021/04/HAWKINS.pdf [RETRIEVED  29/06/23]
  [5] Explore global supply chain data, https://opensupplyhub.org/ [RETRIEVED 29/06/23]
  [6] HOW ONE TRADE ASSOCIATION IS HELPING RETAILERS COLLABORATE, https://www.rila.org/focus-areas/public-policy/how-one-trade-association-is-helping-retailers-col [RETRIEVED 29/06/23]
  [7] 'We have to do something', RetailDive, 18/07/22, https://www.retaildive.com/news/retail-scope-3-supply-chain-carbon-emissions/626973/ [RETRIEVED 29/06/23]
  [8] Climate Transition Plans, CDP, https://www.cdp.net/en/guidance/guidance-for-companies/climate-transition-plans [RETRIEVED 29/06/23]
  [9] Shoppers want transparency in the supply chain, Supply Chain, 13/12/21, https://supplychaindigital.com/sustainability/report-shows-shoppers-want-transparency-supply-chain [RETRIEVED 29/06/23]
  [10] How supply chain transparency can help businesses make the right calls, WEF, 19/06/20, https://www.weforum.org/agenda/2020/06/supply-chain-transparency-can-pre-risk/ [RETRIEVED 29/06/23]
  [11] Topographical intelligence in business, https://medium.com/wardleymaps [RETRIEVED 29/06/23]
  [12] Deforestation-free supply chain, Unilever, https://www.unilever.com/planet-and-society/protect-and-regenerate-nature/deforestation-free-supply-chain/ [RETRIEVED 29/06/23]
  [13] Measuring a company’s entire social and environmental impact, B CORP cetification,  https://www.bcorporation.net/en-us/certification/ [RETRIEVED 29/06/23]
  [14] 100% slave free the norm in chocolate , TonysChocolonely, https://tonyschocolonely.com/uk/en/our-mission [RETRIEVED 29/06/23]
  [15] A Coalition for collective action, Sustainable Apparel Coalition, https://apparelcoalition.org/ [RETRIEVED 29/06/23]
  [16] Explore global supply chain data, OpenSupplyHub, https://opensupplyhub.org/ [RETRIEVED 29/06/23]
  [17] Supply Chain: Going Beyond Compliance, LEVI STRAUSS & CO, 2021 https://www.levistrauss.com/sustainability-report/community/supply-chain/ [RETRIEVED 29/06/23]
  [18] AWS Supply Chain Features, AWS, https://aws.amazon.com/aws-supply-chain/features/#Supply_chain_data_lake [RETRIEVED 29/06/23]
  [19]Shop your Values, Provenance, https://www.provenance.org/directory [RETRIEVED 29/06/23]
  [20] Retailer Net Zero Collaboration Action Programme, WRAP, https://wrap.org.uk/taking-action/food-drink/initiatives/courtauld-commitment/scope-3-GHG-Emissions/retailer-net-zero-collaboration-action-programme [RETRIEVED 29/06/23]
  [21] Take Action, Patagonia, https://eu.patagonia.com/gb/en/activism/ [RETRIEVED 29/06/23]

Thursday, June 08, 2023

What do I use maps for?

It's an interesting question. 

There are some that use maps to challenge what they're doing i.e. "Why are those racks custom-built?"

There are others who use maps to apply the right methods - whether project management or purchasing or finance.


Then, there are those who use maps to anticipate change for reasons of investment or managing inertia or both


Whilst others use maps to convey complicated spaces, either to focus on user needs or innovation or efficiency or even just to discover that one space that people are missing (i.e. virtual is a transport system)


We also have people using maps for strategic play e.g. thinking about ecosystems and where to build to them (one of over 100 different forms of gameplay)


At the same time, others use maps to think about issues of sovereignty beyond territorial and into all the landscapes we compete in (economic, technological, political and cultural) i.e. where should our borders be in a technolocial / economic space, where do we colloborate and where to conflict?


Whilst others use those principles developed from those maps to look at their organisation or those of competitors.


And the list goes on and on. We haven't even talked about the use of maps in contracts or organisational structure or risk assessment or financial flow or removal of duplication or analysis of culture or finding weakness in supply chains or ... well, fortunately the question wasn't "Where can maps be used" but "What do I use maps for"?

Fundamentally, I use them as a means of communication. A way of escaping the tyranny of stories, story tellers, syntax, rules and styles and into a world of objects, relationships, patterns, consensus and context. There isn't a right use of maps, there are many uses and a lot depends upon what a group of people need at the time.

Sunday, May 14, 2023

Why the fuss about conversational programming - Part II

In my last post on conversational programming I asked the reader to "get yourself ready for a world of conversational programming" but I wasn't willing to call it for ChatGPT or the existing crop of LLMs. My advice was one of preparation and not nailing any colours to a mast. There is a reason.

I think GPT4 and systems like Github CoPilot are admirable but probably in the wrong space. I think the breathless horde of consultants prognasticating the replacement of programmers with LLMs have fallen into a trap, not disimillar to their claims in 2011 of cloud saving you money (it doesn't, you end up doing more stuff - see Jevons Paradox) or cloud needing less engineers (see above) or cloud just being for startups. 

In this case, I think the problem is to do with the medium iself.

Don't get me wrong, we're on a path to conversational programming as highlighted by Nicholas Negroponte and his paper "Architecture by yourself". As the paper noted, design is the process of a conversation between two or more pespectives in the minds of one or more designers. In today's case, one of the designers is becoming the machine. That conversation is the heart of conversational programming. But, what we're missing is the graphical conversational part of what is needed. This is the bit that Yona Friedman explored in "Towards a Scientific Architecture".

To explain, I'm going to use a map of coherent city transport. It was created through a discussion between a group of people (from Turkey to Germany to UK to the US) all involved in the transport industry. I've provided the "map" and the code use to create the map in figure 1.

Figure 1 - Coherent City Transport.


The discussion around the map highlighted that in transport planning we often failed to consider one of the major transportation systems effecting the world - that of virtual transport. Every virtual conference, every zoom chat involves a number of "virtual" miles travelled which has an impact on other transportation systems. Unfortunately, we often don't recognise this or even count the virtual miles. We've even built digital twins of cities that have ignored virtual as a transport system. It's a bit like ignoring roads.

If the idea of virtual as a transport system seems odd to you then consider the impact of different modes of transport on road congestion. Figure 2 should bring the message home.

Figure 2 - Congestion on roads by mode of transport.

This realisation of the importance of virtual as a transport system itself occurred through discussion as we explored the things on the map, their relationships with each other and the context they existed in. Now take a look at the code in figure 1. It would be difficult to make that realisation in a medium that is dominated by syntax, style and rules. In reality, the code was only ever the means to make the map. The conversation happened around the map.

Of course, both the text and the map are ways of "coding" the problem space of coherent city travel. One is simply code as text where syntax, styles and rules dominate. The other is simply code as a map where things, relationships and context dominate.

With this in mind, think about where we are with conversational programming today. We're mostly trapped in syntax, style and rules around code as text. We're not really having that conversation with the machine but instead giving it instructions - write this piece of code for me, check my code, improve my code - and being amazed at what it gives back.


A fabulous examples of this was in the NewStack article on "Developers Put AI Bots to the Test of Writing Code". The conversation often veers towards completeness or accuracy of written code but Villegas hits the nail on the head with a verdict that "AI-generated code lacks context-awareness".

That's not a problem with AI but instead the medium via which we are having the conversation. It doesn't matter if it's written or spoken, the medium is still the word, it is text. The power of conversational programming will only be truly unleashed if we can escape from the confines of text (where syntax, styles and rules dominate) and into a world of maps (where things, relationships and context matters).

Before you say "but we can create maps with words" - well, that's exactly what we used to do for navigation. Early forms of navigation were based upon epic sagas that people would learn. These were the written and spoken words for navigation. I probably sound no different from the Viking standing there pointing at squiggles on a parchment and a sun-stone to another group of bemused Vikings who had spent years learning epic sagas word for word. They probably thought that Viking was “off his rocker” and this map thing will never take off. But it did and it will again.

Words themselves are a poor medium to transmit quickly the key information needed in any significant journey. This is why we have used maps in military history as methods of communication and learning. The code for the map in figure 1 is a simplified and constrained language provided through online wardley maps. However, the code for that map contains over 1,700 different words (some hidden as digits, others hidden as links). That is pages of text in which it is hard to see the relationships between things. When we're coding our maps, the only thing that matters is the syntax and completeness of the code to produce the map. The real discussion happens over the map.

That's the world we need to get to, code as maps. At which we point we can have conversations over things, relationships and context (the real substance of a discussion) with the machines as a designer. That's when conversational programming will truly explode onto the scene. Today is just the foretaste of what is to happen.

Yes, I understand that LLMs might replace a lot of writing code itself but if you think that programming was just about writing code then you're missing the bigger picture. The world of writing code as text might diminish but the world of programming has yet to reach its golden age.

I strongly believe that the world of serverless which has already become about stitching components (or gluing things) together and thinking about the context will lend itself more naturally to the world of conversational programming. 
I suspect the techniques for conversational programming which were first hinted at by Aleksander Simovic and Slobodan Stojanovic in the AWS 2018 presentation on "Ask Jarvis to Create a Serverless App for Me" will come out of the rapidly developing open source space around multi-modal systems. 


Don't get me wrong, I admire the work of Bard, GPT4 and Github's Copilot but as engineers we are still stuck in a model of code as text. Our early entrants might have the foresight to declare "We have no moats" but to make things worse, they will already have inertia created by commercial interests.

So, keep exploring. Just remember, this battle for the future of AI through industrialisation of fundamental components is only at the beginning and we maybe in the "Sun Cloud" moment and barking up the wrong tree. That's where I suspect we are and there is much more to come. 

For interest, this is not a unique situation in business or IT. This is no different to the current situation with military organisations around the world slowly realising there are at least five landscapes of sovereignty which matter for the defence of the nation - territorial, economic, technological, political and cultural - and most of us only have maps for one of those landscapes.

Four of the other landscapes are still dominated by text - whether written or spoken. As we've learned in the territorial landscape in the American Civil war, topographical intelligence and situational awareness is critical. For that, we need conversations around maps not better text.

Same with code, same with conversational programming.

ADDITIONAL QUESTIONS

Q. Does that mean all code will be maps?
Of course not. It simply means that much our programming is likely to head in that direction to enable conversations. There will always be a need for the novel and new, the need for optimisations and the deeper you go the more likely you are to meet code as text i.e. maps might be high level but as you dig into a concept you’ll increasingly find graphs and then text alone. This should not surprise you as a graph normally contains some elements of text and a map contains a graph (of the value chain) and associated text. Each level inherits from what it is built upon.

Q. Why not just graphs?
Graphs are a fine tool but remember we're talking about conversions with context which implies some form of landscape. The difference between a graph and a map is that in a map, space has meaning. Which is why they are good for representing landscapes. See figure 3.

Figure 3 - Graphs vs Maps. In a map, space has meaning.


Q. Do you mean your form of maps?
All maps are imperfect representations of a space, they are also models and hence wrong. We use them because they are useful tools of communication but they represent a lossy trade-off between being able to discuss the context and fidelity of detail. It took our geographical brethren thousands of years to get that balance right, we've only be doing this for 18 years. We're more at the Babylonian Clay Tablet stage rather than ordinance survey maps. So, no ... I'm hoping we can create better maps than we have. I simply use my maps as an example — think odd looking Viking muttering about scribbles on parchments and sun-stones

Q. If your maps are wrong and imperfect, why use them?
Our geographical brethren didn't magically create 
1:10,000 scale representations of the landscapes with notable features overnight. These are a starting point for conversation. 

Q. Where would you look for inspiration of this change?
Two places — the open source world and the gaming world, especially the large and still vibrant community around Skyrim SE where both seem to happen. Hence keep an eye on reddit and discord groups. There’s an awful lot of work going into bringing LLMs into Skyrim SE. It’ll be interesting to see what tools they develop.

Q. Is it possible to map this landscape in any meaningful way? It’s a complex adaptive system.
Just because something is a complex adaptive system doesn’t mean everything is unpredictable and that meaningful representations can’t be created. It used to be said that you couldn’t meaningfully graph out an economy until a group in Hungary went and did that using sales tax data (figure 4) and discovered numerous chokepoints in the economy. It’s often a question of finding the right perspective and right data.

Figure 4 — Graph of the Hungarian economy. Source : https://phys.org/news/2022-05-country-entire-economy-predictand-forthe.html

Q. We are moving from “describe the code” to “describe the app”?
That’s a nice idea but it’s slightly more than that. Describing the app still evokes concepts of commands and instructions i.e. build me this thing, I’d like buttons in cornflour blue. The future of conversational programming is more likely to start with the question of “describe your need”. In many cases, conversational programming may never need a single line of code written.

Monday, January 30, 2023

Why the fuss about conversational programming?

(a slightly more upto date version is on medium - I keep these as my original first drafts).

First, there isn't much fuss ... yet. But there will be.

To understand why, I'm going to build on my previous HackerNoon post on "Why the fuss about serverless". That post discussed the historical rise of DevOps associated with changing characteristics of compute (the shift from high to low MTTR), the rise of serverless and the development of an emerging practice built upon serverless. I called that practice FinDev in 2016. In the end we finally got a moniker of FinOps (2018) and subsequently a foundation, a book (O'Reilly Cloud FinOps) and several conferences built around those concepts of visibility into financial value and gluing together component services. This is all good but it's not the end of the story.

One of the questions that I was asked back in 2016 was "What comes after serverless"? I responded "Conversational programming". It's about time that I make clear what I mean and what its impact is going to be. At the same time, it's probably worth discussing platform engineering which is a combination of the useful with the downright harmful. However, before we can get started, you'll need some background information.


BACKGROUND

For this post, I'm going to assume that you have a passing familiarity with mapping, you have read the previous post on serverless and concepts like co-evolution are not alien to you. I'm also going to use the current popular terms like composable architecture (old skool was componentisation, they are the same thing) which are all derived from the ideas of compositionality - the ability to break down into and build with components. Just in case, I'll re-emphasise that :-

1) co-evolution refers to the change of practice with the underlying evolution of the technology due to its changing characteristics. For example, as compute evolved from product to a utility (nee cloud) then the change of characteristic from high to low MTTR (mean time to recovery) enabled a new set of practices to form which later became known as DevOps.

2) Red Queen refers to how we have no choice over evolution. As a technology evolves to more of a utility, we gain operational efficiency plus speed (due to the co-evolved practices) plus new sources of value as the combination of efficiency and speed allows us to create new things which we previously only dreamed of. These "new" things exist in the adjacent unexplored, the space of options that was previously too costly for us but evolution of technology has now enabled. As a competitor adapts they gain efficiency, speed and value which creates pressure on all others to adapt. This pressure mounts as more competitors adapt until all are eventually forced to change. It's why guns replaced spears or electric lamps replaced gas lamps.

3) Inertia refers to our reluctance to adapt to this new world. There are 16 different forms of inertia including pre-existing capital, pre-existing business model, loss of political capital and so forth. In general terms, it's our past success with an existing model of technology that creates inertia to adapting to the new world. 

With these basics in place, let us draw a map of the existing landscape.


THE MAP


Let us start with a basic map of technology, see figure 1.

Figure 1 - A basic map of technology


In the map above, a user has some need which is normally met by an application running on a device. The application is coded in some form of IDE which is built upon some concept of coding practice. That coding practice requires a run-time (e.g. Lamp or .Net) which has composable elements (e.g. libraries) which in turn run in some form of container (whether a virtual container or operating system). These containers runs on some form of compute provided through a concept of architectural practice (e.g enterprise class machines).

A number of components are shown as squares. These represent a pipeline of choice i.e. for applications we have a choice from novel apps to common place apps. Pipelines are used in maps when we have mutliple things with a common meaning i.e. power can mean renewable or fossil fuel or nuclear. Each of the choices that we can make are often independently evolving things. We can also use a pipeline to represent a choice in the evolution of a thing for example when discussing TV series we can talk about the first ever example for a particular format (X Factor) or a more evolved and repeated format (X Factor USA, x Factor UK, X Factor etc).

To explain this more clearly, let us expand out the map to discuss the serverless space.

Figure 2 - The Serverless Map.


In the map above, I've expanded out a number of the pipelines. For example, in compute we had the choice to use servers or cloud circa 2006 and onwards. For architectural practice we had developed best practice for use of servers (capacity planning, scale up, N+1, disaster recovery test) and we developed emerging architectural practices for compute as a utility (cloud). That practice evolved, was given a name DevOps and is currently good practice (there is a convergence in terms of what DevOps means). The "best" practice for compute as a product is these days called Legacy.

Equally, from 2014, the run-time has the option of Lamp / .Net or serverless environment such as Lambda or Azure. The coding practice itself has changed (the subject of the earlier post) with greater use of financial metrics and component services with the code acting more as a glue.

Now, all of these components are evolving, so let us bring it upto date by marking on the evolution and actually date the map. Given we're already discussing discrete components in the pipelines, we can simply remove the surrounding pipelines. This give us figure 3.

Figure 3 - Serverless Map, 2023.


From the map, servers shifted to cloud and enabled a practice called DevOps which is rapidly evolving heading towards best architectural practice for cloud. The legacy practice is actually best architectural practice for compute as a product (i.e. servers) but we call it legacy because it's on the way out. Common libraries are evolving to more component services in the FinOps world of serverless whereas best coding practice for use of Lamp / .Net is built upon the concept of common libraries. It too is destined for a moniker of legacy. The Lamp / .Net world is tightly linked to underlying orchestration tools and containers whereas in the serverless world the underlying architecture is abstracted away. In other words, in the serverless world you don't care about underlying infrastructure.

Of course, there will always be exceptions such as being a major scale provider of a component i.e. AWS worries about racks and physical servers because it provides EC2. It worries about infrastructure because it provides Lambda. However, most of us do not operate at this hyperscale and resistance to using such services is not normally based upon positive ideas of a better service but fear i.e. fear of lock-in, fear of loss of control. In other words, it's normally inertia to change or in some cases a percieved regulatory barrier to adoption. I say perceived because in almost every single instance where I've been told "the regulators won't allow us" - the regulators weren't actually the problem.

This is not to say that lock-in is not a concern but our lack of understanding of physical and digital supply chains including how evolved the components are, the excludability of components, their substitutability and rivalrousness means that we have little to no visibility of the risk in our supply chains. Even the US executive order for SBOMs is only a starting point on a very long journey. The blunt truth is that Microsoft, Google and AWS will almost certainly have a far better understanding (as exhibited by their ability to provide some embedded carbon information) of their supply chains along with greater resilience than your home grown operation. In a global shortage for silicon chips, these hyperscalers are more likely to secure supplies than your "mom and pop" investment bank operation serving a few million customers or your "corner shop" University with a few tens of thousands of students. Anyone in purchasing will tell you tales of how difficult it has been to get hold of computers and peripherals.

WHAT IS CONVERSATIONAL PROGRAMMING?

When you think about the act of writing an application today, it is often an act of gluing together a few discrete component services with some code in a utility run-time environment such as Lambda. Well ... at least, it should be. There are an awful lot of organisation dealing with much lower order components such as racking machines or worrying about container orchestration than there needs to be. That's normal, the Red Queen effect doesn't mean everyone changes at the same time. It's a non linear shift (often called a punctuated equilibrium) and companies will get there eventually. However, if you want to read about what good looks like then I'd suggest "The Value Flywheel Effect".

Even in this serverless world, the act of programming still requires you to think about what component services need to be glued together. That means you have to break down the problem into components, find component services that match, determine what is missing and hence what you will need to build, then build it and glue it all together. That is still a lot of work to be done and to be blunt, it's work that can mostly be automated and achieved through some form of intelligent compiler. This leads us to conversational programming.

Let us think about our IDE (integrated development environment). Today, they are very human centric i.e. built upon an expectation that humans will write the code. 
In a conversational programming world you tell the system what you want, or least provide it prompts for that. The IDE will be more built around the concept of Human + AI rather than just human. Let us map that out in figure 4.

Figure 4 - Conversational Programming, 2022


The rapid evolution of large language models towards more of a commodity service will enable more conversational styles of programming. If you think this is science fiction then an example of this was provided at AWS RE:Invent in 2019 by Alex. This doesn't mean that the system will build everything for you, there will always be edges that need to be crafted but the majority of what is built today is repetition of code that has already been done. 

The modern description of conversational programming is prompt engineering. Examples of which can be seen using large language models such as OpenAI. It's only a matter of time before OpenAI is tightly coupled into Azure's development environment and programming will start to look more like a conversation between an engineer with an AI making recommendations for changes and addition of services. If you wish to see the future then a wondeful example of conversational programming can be found in the marvellous StarTrek Voyager and the "Delete the wife" scene.

Of course, much of this will start with text based system but it's a small jump to voice from there. What is relevant is the conversation itself and not the medium (text or voice). One thing you might note in the map is how I've linked FinOps to conversational programming. Serverless has brought remarkable changes such as refactoring having financial value to the focus on financial visibility within code (including carbon cost of code) and these are unlikely to be lost in a conversational programming world. Again, those decisions are ones which an AI can help with. It's not just the code itself (and reducing duplication) that will matter in these IDEs but the meta data suchy as the cost per function and capital flow within an application whether carbon or dollar or yuan.

We're still waiting for those conversational programming environments to fully form but we're getting close. The technology is there (i.e. large language models), the concept is there (i.e. conversational programming) and the attitude is there (i.e engineers getting swamped by complexity). All the factors needed are in place, it's only a question of how quickly this evolves and which actor launches first - Microsoft or AWS? Of course, whomever launches first and drives this to more of a utility will gain the advantage of the meta data for applications built on top. This is a huge strategic advantage which in the past AWS has thoroughly enjoyed and made use of (see Reaching Cloud Velocity) and it's at the heart of the ILC model (described in that book). Which is why I can't see AWS doing an IBM and letting Microsoft walk away with this show. It'll be an interesting battle.

I want you take a moment to think about this. The speed of one company with engineers building systems through conversational programming (i.e. a discussion with the system) versus the speed of a company whose engineers are messing around with containers and orchestration systems (such as kubernetes clusters) versus the speed of a company whose engineers are still wiring servers in racks. I want you to think about the Red Queen effect and realise that you will have no choice over this evolution.

SO WHEN WILL THIS HAPPEN?

Back in 2019, I put together a rough timeline for when this would all start to kick off, see figure 5. I put a stake in the ground around 2020 to 2023 which means sometime this year. However, it depends upon actors actions which are notoriously difficult to predict and we've had a number of shocks to the economic system. That said, with systems like GitHub's CoPilot, you could argue we've already started.

Figure 5 - Timeline, 2019.


As with all these changes (cloud plus devops, serverless plus finops, conversational programming plus any new moniker for the practice to built on top), there will be the usual gains in efficiency, speed and new sources of value. It will be a punctuated equilibirum (non linear change) which means it will seem to be growing slowly but the doubling rate will catch out most analysts. There will be the usual inertia, the usual crowd of CxOs dismissing it as a fad followed by the usual panic and scramble for skills. There will also be the usual nonsense peddled by large management consultants. It's probably worth listing these :-

1) You'll need less engineers. Nope. See Jevon's paradox. You'll need to retrain to a new world but you'll end up doing more stuff. You'll need those engineers.

2) It'll reduce IT budgets. Nope. See Jevon's paradox again. You'll end up doing more stuff, more cost efficiently.

3) You have choice. Nope. See Red Queen Effect. This is only a question of "when" not "if".

4) It's only for startups. Nope. Startups have less past success and hence lower inertia barriers to change. Large enterprises will resist the change due to the pre-installed capital. Eventually, they will have no choice. See Red Queen Effect.

5) We can build our own. Nope. Well, technically you can but you'll regret it. Doesn't mean that want stop hordes of self interested vendors trying to persuade you to do so for reasons of "security", "lock-in" and "customisation to your needs".

6) I can make a more efficient application by hand crafting the code. Nope. Well, technically you can but the time taken to hand craft it all will be vast (especially if you decide to go down to the level of containers or even worse hardware) compared to the speed at which competitors will move. I'd also suggest reading into Centaur Chess if you think even the most gifted engineer will outcompete an average engineer with an average AI.

7) It'll be the death of DevOps / FinOPs etc. Nope. Well, technically it will be but that takes a very long time. Never underestimate how long legacy (i.e. toxic) IT sticks around. So whilst it'll take 5-8 years to see who the winners and losers in this conversational programming world are, it'll take 10-15 years to become seen as the new norm and anywhere from 30 to 45 years for the old world to truly disappear into very small niches.


A NOTE ON PLATFORM ENGINEERING

If I look at the map above, then all those components on the right hand side can be discussed as building a platform - a cloud platform of utility infrastructure, a serverless platform, a platform of component services and eventually a conversational programming platform etc. In general, it's not a good idea to provide components as services exposed through APIs to others unless those components have become industrialised which is why conversational programming requires large language models to become more industrialised.

There are a number of discrete skills - code respository, toolsets, monitoring - around those "platforms" but in general the main platform principles needed are build discrete components, build WITH discrete components and shift as much of the platform to utility providers. Unfortunately, the term platform engineering seems to have got wrapped up with the idea of building your own platform. This is downright harmful if there are utility providers out there. I've even listened to people talk about their data centres as a platform. I'm afraid, those companies are going to struggle in a world of conversational programming particularly as the training for some of these large language models can run into the hundreds of millions of dollars. I'm sure there will be vendors willing to sell you this but I would pause before spending and think about all those large data lakes you were sold and how much ROI you actually got or think about those private cloud efforts or how much return you're getting on a kubernetes cluster in a world of serverless? Caveat Emptor.

WHAT COMES NEXT?

Oh, that's where the fun really starts. If you look further up the map (figure 4) around the area of application and device this is where we get into the world of Spimes and SpimeScript. Though I suspect we're going to call that CyberPhysical. Anyway, that's another post for another year, we're quite some way from that at the moment.


SUMMARY

In summary, get yourself ready for a world of conversational programming. We're not quite there yet but we should be there soon. When it arrives, embrace it and thank me later.