A map has an anchor. In chess, it's the board. In geographical maps it's the compass. In a Wardley map, it's the user need (of course, I'm assuming you've actually described the user journey and know what those needs are).

A map has position (relative to the anchor) and the ability to show movement. In Chess, it's the position of pieces on the board and where they can move to. In geographical maps, it's the position relative to compass setting (northwest of here or in more advanced forms, GPS) and the features that enable or hinder movement (a cliff, a road). In a Wardley map, position is shown through a chain of needs and how visible the component is to the user (the anchor) whilst movement is shown through evolution.

There are many types of pieces on a map. In Chess, well that's obvious. In geographical maps these are landmarks or troops (in combat). In a Wardley map, you have many different types of activities, practices, data and knowledge.

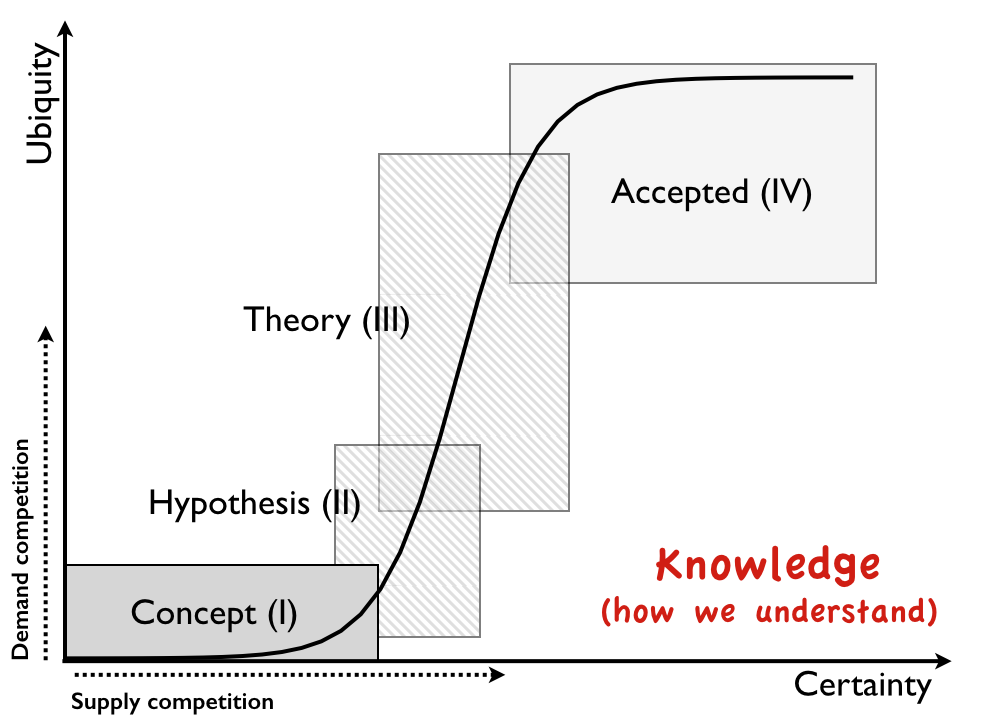
All of these types in a Wardley map are evolving and co-evolving. The x-axis is just short-hand for evolution and I chose activity as the most useful description. But all of these types evolve through different stages (I to IV) over ubiquity and certainty. This is driven by competition and causes common characteristic changes.


Unfortunately, to see evolution then you have to abolish time and measure over ubiquity vs certainty. This is not adoption vs time (a diffusion curve) which measures diffusion. Diffusion and Evolution are not the same thing but they are related (i.e. evolution consists of many diffusion curves).
Because we have no crystal ball (i.e. you can't measure evolution over time and predict the future accurately) then you have to deal with the certainty axis and that things start of as uncertain. In practice this means you can only accurately map where something WAS once it has become a commodity. To estimate where something IS then you have to use weak signals or discussion between a group familiar with the field. Evolution just shows you the path, the future still remains an uncertainty barrier we can't peak through but we can approximate.
The cheat sheet (more accurately, my cheat sheet) is based upon weak signals for each stage (I to IV) and is broadly applicable across all types (some of the characteristics are specific to a type but it's a good enough approximation).

Once you have a map of your landscape, you can start to learn about common climatic patterns, use it to apply universal doctrine such as removing duplication and bias, use it to communicate and challenge assumptions, use it for context specific gameplay (i.e. strategy) and learning of such, use it to link strategy to operations, use it determine flow, use it for organisation ... in fact, you can do an awful lot with a map.
Four final notes.
1. The only people who can map an industry are those that work in that industry. You have to learn to map and play the game for yourself. By all means you can use consultants to advise on different forms of gameplay (assuming they know any context specific forms) but the only person who can map your environment is ... YOU.
2. No map is "right", it's an approximation and open for challenge. The beauty of drawing a map is that it can be challenged easily. The key to mapping is don't try and create the perfect map but quickly draw the environment and share with others. With practice, you should be able to map a business in a few hours. NB. This means YOU, not someone else.
3. Mapping itself is not "right". These are Babylonian clay tablets for business. Someone will make a better way of mapping. All models are wrong, some are however "useful". Trying to determine strategy or operate a company without understanding your landscape is something that I don't find to be useful.
4. The Wardley Mapping technique is creative commons share alike, it has been for almost a decade. I found it useful, so I gave it away in the hope that others would.