INTRODUCTION
Over the last 15 months, I've been working on a research project with many volunteers to map different industries. This has been an exercise in exploration.
Most of us are familiar with using maps to apply appropriate methods, whether project management o finance. We're equally familiar with how to challenge what is being done or to find areas where we need to concentrate on efficiency or innovation or customer focus. But how do you map an industry? Which maps right? How do you find what is or maybe important?
The research has covered twelve industries and two technology sectors so far with over 300 volunteers (including 220+ involved in the primary research). Those volunteers have been from across the globe all working openly using zoom, miro and maps. I'm incredibly grateful for the effort that has been put in, and I thank you for all that was done.
In the next series of posts, I'm going to share the raw reports that we've written, including the maps and the process used. If you use online wardley maps then you'll also find the code in my github - https://github.com/swardley/Research2022
A more polished version of these reports will be available on the DXC Leading Edge site and I'll provide a link to that when they are completed.
The industries covered include retail, manufacturing, construction, defence, transportation, healthcare, government, education, finance, agriculture, energy and telecoms.
The technology sectors include AI and Cybersecurity. Though we have new sessions coming up on sustainability, gaming, the future of workplace and even quantum computing. This project is very much ongoing.
REPORT - RETAIL
1. THE FUTURE OF RETAIL IS AT A CROSSROADS
On one hand, retail faces several challenges including the rise of e-commerce, the need to improve sustainability, and the increasing demands of consumers for transparency. On the other hand, there are also several opportunities for retailers to thrive, such as the growth of omnichannel retailing and the increasing use of data analytics to refine customer journeys. Given this, where should we focus our investment?
In this evolving landscape, one set of emerging and critical issues facing the retail industry are integrity and transparency. In recent years, there have been several high-profile scandals involving retailers, such as the use of child or slave labour and the sale of counterfeit goods[1]. These scandals have eroded consumer trust[2] and made it clear that retailers need to do more to ensure that their supply chains and their practices are ethical and sustainable. Unfortunately, we have future potential scandals heading our way, from low pay to misuse of BNPL[3] (buy-now-pay-later) and EWA[4] (earned-wages-access). One area we should focus on is the need to act with integrity and transparency, avoiding spin and admitting mistakes when they happen.
Another issue facing the retail industry concerns collaboration. To meet the demands of consumers and stay ahead of the competition, retailers need to share information and work together. However, despite early efforts such as Open Supply Hub[5], there is often a reluctance to share information, as retailers fear their competitors will benefit from it. Our second area of focus is the need to dare to share and as RILA[6] states “collaboration makes retailers better competitors”.
Finally, the industry requires metrics that drive sustainable choices. That’s not to say we don’t have metrics; we have lots of them. Unfortunately, due to the complexity of supply chains and a lack of transparency, there is a heavy reliance on estimation. The industry is “woefully behind on scope three targets”[7] which can account for 90% of emissions. Our third area of focus for retailers is the need to make use of meaningful metrics that reflect the true impact of their operations on the environment and society, including using more scientific and data-driven metrics that can accurately measure things like carbon emissions, water use, and waste production. Unfortunately, according to a 2022 CDP study[8], less than 35% of companies’ emission reduction targets are credible.
Whilst integrity, sharing and meaningful metrics might sound a bit soft in the rough and tumble of commerce, a 2021 study[9] by Avery Dennison suggests that consumers want transparency in their supply chain, and a 2019[10] study by the World Economic Forum highlighted that leaders are often operating blind and less capable of managing shocks to the system. These “soft” issues have material impacts.
The three key messages, challenges and actions are summarised in the following 6-box. The rest of this report will discuss how they were determined and why they are considered priorities.
Figure 1 – The six boxes.
2. EXPLORING THE WORLD OF RETAIL
In 2022, DXC Leading Edge brought together a team of 226 volunteers to explore 12 different industries. Thirteen of the group chose to explore what mattered for the future of retail. This “retail” team had a wide variety of experience in the retail sector, from senior leadership of large global conglomerates to startup founders. Our initial problem, as with all the groups, is that we started with no agreed method to explore the future. The exploration process emerged during the research project through the interactions of all the teams. That process involved the following steps.
2.1 Collect words.
To begin with, the group created a cloud of words that they felt were important to the future of retail. This varied from loyalty programs to last-mile delivery, from virtualisation of goods to influencers (see Figure 2.1). There was no initial consensus.
Figure 2.1 – the cloud of words related to the future of retail.
2.2. Categorise.
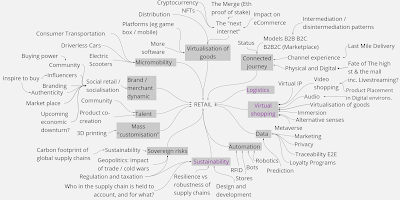
The words the group created were often connected with each other. Consumer transportation, driverless cars and electric scooters have a relationship around mobility. The team explored those relationships and created a graph of the space connecting each word to a theme (see Figure 2.2).
Figure 2.2 – the categorisation of words into themes.
The team then chose three themes they wished to explore: sustainability, shopping (an expansion on virtual shopping) and logistics. The chosen themes would become our perspectives from which to map retail.
2.3 – Mapping
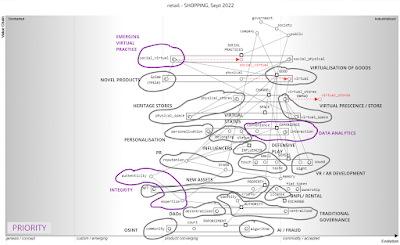
The group mapped[11] each of the three chosen perspectives of retail, starting with concepts of user need, the components involved, and how evolved the components were. The maps were continually refined until the group considered the map was good enough to describe the space. On average this would take 6-14 hours per map. For illustrative purposes, one map on the perspective of shopping is given in Figure 2.3. The remaining maps on sustainability and logistics are provided in the appendix.
Figure 2.3 – Retail Map from the Perspective of Shopping.
Several aspects of the map were highlighted, including:-
1) how virtual stores allowed for a much greater industrialisation than physical stores.
2) how channels depend upon the choice of spaces (physical, virtual or both) and the experience that we create with them.
3) how space is connected to social practices, i.e., we’ve learned how to operate and interact with others in different physical spaces, but many are just learning the techniques required in the virtual space.
2.4 Analysis
For each of the three maps, areas where an organisation may choose to invest were highlighted. Once the list was considered reasonably exhaustive, the group identified for each map a few high-priority areas (see Figure 2.4). In the case of shopping, the high-priority areas were data analytics (specifically associated with the customer journey), emerging virtual practices (the social practices by which we interact with others) and integrity.
As one of the retail team commented, “mapping out the space helped us [the retail team] to think deeply about the chosen perspective and what needed to change in ways we hadn’t considered before”.
Figure 2.4 – Retail Map from the perspective of shopping, including investment areas.
The reason for using multiple perspectives is that it would enable us to aggregate importance across various maps. This is the real magic of the technique. For the reader, imagine a world where no previous maps exist. You’ve just received the first-ever maps of Paris created by three different groups. How do you know which map is correct? How do you know what landmarks are important? You look at a single map and it highlights the Eiffel Tower and Pierre’s Pizza Parlour but which is more important? You’ve never been to Paris.
By asking multiple cartographers to highlight essential features on their maps and then aggregating across them then you are more likely to find the important landmarks regardless of perspective. In the Paris example, you’ll quickly find that the Eiffel Tower is a familiar landmark across many maps compared to Pierre’s Pizza Parlour which may only appear on one.
This is precisely what we are doing: creating three perspectives and consolidating across them in an attempt to find the landmarks that matter.
2.5 Consolidation to important landmarks.
First, we aggregate across the maps , creating a priority order based on the frequency at which an area (for example “virtual goods”) is highlighted and any priority given. In the case of retail, those areas of highest priority across all maps included: - awareness of the supply chain (high), integrity (high), data analytics (focused on customer journeys), sustainability, measurement, emerging virtual practices and distribution (of storage and inventory). This order was then compared against the aggregated results of 14 analyst reports as well as comparison to ChatGPT-4 and BARD. See figure 2.5
Figure 2.5 – Consolidation and comparison to Analysts, ChatGPT-4 and BARD.
2.6 Discussion
By examination of Figure 2.5, a number of observations are made.
1) The difference between the views of analysts and those of the retail team are so wide that you can say that retail is standing at a crossroad. On one hand the analysts would have you follow a path focused on personalisation (high) and data analytics (high). The retail team would have you follow a path of awareness of the supply chain (high) and integrity (high).
2) ChatGPT and BARD had high levels of agreement between themselves along with a tendency to agree with the analysts. As large language models trained on relatively recent text, the priority order created by ChatGPT-4 and BARD should statistically reflect how common the terms appeared in common text i.e. whether analysts and others were writing about it. Hence, you would expect some level of consensus. Volatility between ChatGPT-4, BARD and the analysts would imply high levels of uncertainty in the field. Care must be taken to use prompts that forced both LLMs (large language models) to stick to sorting the given list rather than answering the question of what matters. One notable variation is the LLMS tended to agree more with the retail team on the issue of supply chain awareness.
3) The retail team’s priority order tended to have words that were implied from (rather than being identical) to those that the team originally collected (figure 2.1.) For example, the phrases “carbon footprint of global supply chains”, “resilience versus robustness of supply chains” and “Who in the supply chain is held to account” implies an “awareness of supply chain” which emerged during the mapping process as being the highest priority focus.
4) The priority order represents a general consensus between the team. Obviously, the actual priority order for a retail company will depend upon its context. Two areas with strong consensus for the retail team were how poorly understood supply chains were and integrity. Poor awareness of the supply chain has an impact on other topics from resilience to crisis management to sustainability. A lack of integrity in the industry creates a history of scandals, from the use of slave labour to fraud to poor wages. Two current trends that were highlighted and felt likely to cause future scandals were BNPL (Buy Now Pay Later) and EWA (Earned Wages Access). The former, which allows retail to arrange bank loans for purchases seems to be a very positive change on the surface, with retailers increasing revenue (any loan interest paid as the product discount), banks receiving interest (the loans are packaged into collateralised obligations which are sold to other markets) and consumers receiving products they want (with interest-free loans). Unfortunately, such schemes have been used to buy staple goods, and the concern is the creation of a new debt bubble with retail at heart. The latter, EWA, again seems optimistic, allowing employees to gain access to earned wages and avoid using payday loans. In effect, however, this is an interest-free payday loan, and the group highlighted how this was not solving the fundamental problem of low wages and could instead create entrapment.
Based upon the maps created, the areas highlighted for investment, the consolidation of these areas to form a priority list and comparison to analysts, and the subsequent discussion, the following six boxes were created (a repetition of the previous Figure 1)
Figure 2.6 – Six Box.
2.7 Leading practice
During the research process, several companies were highlighted for what the group considered leading practice. A selection is provided as a guide for the reader.
- Deforestation-free supply chain by Unilver[12]. In particular the focus on using crowdsourcing
- B Corp certification[13]. For completeness of the entire process.
- 100% slave free the norm in chocolate by Chocolonely[14]. For clarity of purpose and focus on awareness.
- A coalition for collective action by Sustainable Apparel Coalition[15]. For collective action and sharing
- Explore global supply chain data by Open Supply Hub[16]. For collective action and sharing
- Supply chain: going beyond compliance by Levis Strauss & Co[17]. For exceptional honesty and transparency in the complexity of supply chains
- AWS Supply Chain Features by AWS[18]. For breadth of vision and provision of core components.
- Provenance[19]. For provision of mechanisms to clarify claims made by retailers.
- Retail Net Zero action plan by WRAP and WWF[20]. For collective action and focus on standardising measures.
- Activism by Patagonia[21]. For direct action and integrity.
3 PROCESS
The complete process of determining the six box, starting with the collection of words to categorisation to mapping to analysis to consolidation and finally synthesis is shown in Figure 3.
Figure 3 – the complete method.
Whilst the method enabled us to determine a different view for retail, it is likely affected by the number of perspectives used. In this case, three were used and hence and the result can only be considered relevant to those three perspectives. As more perspectives are added, a more accurate picture of what matters in an industry should be generated.
The process is relatively time-consuming: -
- Collection of words: 1 hour
- Categorisation of words and selection of perspectives: 1 hour
- Mapping of perspectives: 6 – 14 hours per map.
- Analysis of map and selection of priority areas: 2-3 hours.
- Consolidation and comparison: 2-3 hours
- Synthesis: 3-4 hours.
The entire process can take 15-26 hours, assuming any mapping work is done in parallel.
Further studies intend to examine the validity of this process. Whilst it enables us to find a different view on what we should be investing in, whether that view is more accurate than simply listening to analysts remained unanswered.
4 NOTES
The research was completed with the aid of over 226 volunteers and hence all maps and analysis are provided as creative commons share alike. This includes the research process itself.
5 APPENDIX
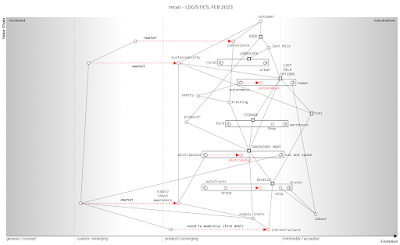
Figure 5.1 – Retail Map from the perspective of logistics
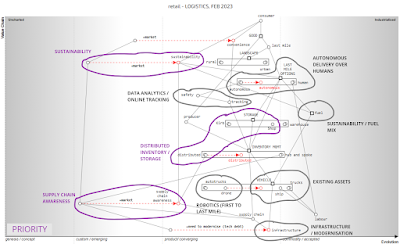
Figure 5.2 – Retail Map from the perspective of logistics, including investment areas.
Figure 5.3 – Retail Map from the perspective of sustainability
Figure 5.4 – Retail Map from the perspective of sustainability, including investment areas.
6 REFERENCES
[1] "We have lost a lot of control", Guardian UK, 16/04/03, https://www.theguardian.com/world/2023/apr/16/uk-at-risk-of-food-safety-expert-warns [RETRIEVED 29/06/23]
[2] Retail has a customer trust problem. RetailWire, 22/02/03, https://retailwire.com/discussion/retail-has-a-customer-trust-problem/ [RETRIEVED 29/06/23]
[3] Buy now, pay later schemes increasingly an avenue for financial abuse, Guardian UK, 15/11/22, https://www.theguardian.com/business/2022/nov/15/buy-now-pay-later-bnpl-schemes-financial-abuse-report [RETRIEVED 29/06/23]
[4] EARNED WAGE ACCESS AND THE END OF PAYDAY LENDING, Boston University Law Review, Vol 101:705, https://www.bu.edu/bulawreview/files/2021/04/HAWKINS.pdf [RETRIEVED 29/06/23]
[5] Explore global supply chain data, https://opensupplyhub.org/ [RETRIEVED 29/06/23]
[6] HOW ONE TRADE ASSOCIATION IS HELPING RETAILERS COLLABORATE, https://www.rila.org/focus-areas/public-policy/how-one-trade-association-is-helping-retailers-col [RETRIEVED 29/06/23]
[7] 'We have to do something', RetailDive, 18/07/22, https://www.retaildive.com/news/retail-scope-3-supply-chain-carbon-emissions/626973/ [RETRIEVED 29/06/23]
[8] Climate Transition Plans, CDP, https://www.cdp.net/en/guidance/guidance-for-companies/climate-transition-plans [RETRIEVED 29/06/23]
[9] Shoppers want transparency in the supply chain, Supply Chain, 13/12/21, https://supplychaindigital.com/sustainability/report-shows-shoppers-want-transparency-supply-chain [RETRIEVED 29/06/23]
[10] How supply chain transparency can help businesses make the right calls, WEF, 19/06/20, https://www.weforum.org/agenda/2020/06/supply-chain-transparency-can-pre-risk/ [RETRIEVED 29/06/23]
[11] Topographical intelligence in business, https://medium.com/wardleymaps [RETRIEVED 29/06/23]
[12] Deforestation-free supply chain, Unilever, https://www.unilever.com/planet-and-society/protect-and-regenerate-nature/deforestation-free-supply-chain/ [RETRIEVED 29/06/23]
[13] Measuring a company’s entire social and environmental impact, B CORP cetification, https://www.bcorporation.net/en-us/certification/ [RETRIEVED 29/06/23]
[14] 100% slave free the norm in chocolate , TonysChocolonely, https://tonyschocolonely.com/uk/en/our-mission [RETRIEVED 29/06/23]
[15] A Coalition for collective action, Sustainable Apparel Coalition, https://apparelcoalition.org/ [RETRIEVED 29/06/23]
[16] Explore global supply chain data, OpenSupplyHub, https://opensupplyhub.org/ [RETRIEVED 29/06/23]
[17] Supply Chain: Going Beyond Compliance, LEVI STRAUSS & CO, 2021 https://www.levistrauss.com/sustainability-report/community/supply-chain/ [RETRIEVED 29/06/23]
[18] AWS Supply Chain Features, AWS, https://aws.amazon.com/aws-supply-chain/features/#Supply_chain_data_lake [RETRIEVED 29/06/23]
[19]Shop your Values, Provenance, https://www.provenance.org/directory [RETRIEVED 29/06/23]
[20] Retailer Net Zero Collaboration Action Programme, WRAP, https://wrap.org.uk/taking-action/food-drink/initiatives/courtauld-commitment/scope-3-GHG-Emissions/retailer-net-zero-collaboration-action-programme [RETRIEVED 29/06/23]
[21] Take Action, Patagonia, https://eu.patagonia.com/gb/en/activism/ [RETRIEVED 29/06/23]


